| Above: Wind and water from Hurricane Florence damages the highway leading off Harkers Island, N.C. on Friday, Sept. 14, 2018. (Jordan Guthrie via AP) |
Hurricane Florence made landfall in Wrightsville Beach, North Carolina, at 7:15 am EDT as a Category 1 hurricane with 90 mph winds. (Update: Florence was downgraded to a tropical storm at 5 pm EDT Friday). We may not be even halfway to the midpoint of Florence’s impacts, though. The storm continues to pull vast amounts of moisture into North Carolina and push seawater across barrier islands and into coastal inlets. Storm surge rapidly swept into the Wilmington area at midday Friday. From Friday into Saturday, some locations may see an additional one to two feet of rain (or more). It will be at least early next week—when river flooding will still be on the increase—before we even begin to have a full handle on the havoc wrought by this hurricane.
P R A Y F O R N E W B E R N #NewBern #HurricaneFlorence pic.twitter.com/UEhny4xvue
— YEIWAYY (@doseofyei) September 14, 2018
At noon Friday, Florence was moving very slowly toward the west-southwest at just 3 mph, and was centered about 25 miles southwest of Wilmington, NC. Top sustained winds were 80 mph, making this a Category 1 hurricane, but the Saffir-Simpson scale provides only one limited snapshot of a hurricane’s power. Florence will continue to pose a critically dangerous, top-end rainfall and flood threat in parts of the Carolinas for days to come.
 |
| Figure 1. WU depiction of NEXRAD/NWS radar at noon EDT Friday, September 14, 2018, showing Hurricane Florence centered just southwest of Wilmington, NC. |
Rainbands extending far from the center of Florence continue to pivot into the state, including across some of the areas hardest hit on Thursday night. Caught amid very weak upper-level winds, Florence will inch its way along the NC/SC coast, reaching the Myrtle Beach area on Friday night, before its core finally moves fully inland on Saturday, most likely as a tropical storm. Florence is predicted to gradually accelerate into central South Carolina by Saturday afternoon. By Sunday, as a weakening tropical storm or depression, Florence will climb the higher terrain of the Appalachians, which will squeeze out yet more rainfall. Finally, as stronger steering currents kick in, Florence or its remnants will race toward New England early next week, still depositing localized heavy rain along the way.
 |
| Figure 2. Water levels in Beaufort, NC during Hurricane Florence. The blue line is the expected water level, which fluctuates by about 4 feet with the tide; the red line is the observed water level (the storm tide), and the green line is the difference between the two (the storm surge). Image credit: NOAA Tides and Currents. |
Record-high water level observed at Beaufort, NC
There are three tide gauges on the southern North Carolina coast with long-term records extending back into the 1950s: at Beaufort near Morehead City, on the Cape Fear River in Wilmington, near the NC/SC border, and at Wrightsville Beach, 10 miles east of Wilmington. This morning at 3:24 am EDT, a storm surge of approximately 5.51 feet was recorded at the Beaufort gauge. Fortunately, the tide was receding rapidly at that point, but the storm tide (the combination of the surge and tide) still set an all-time water level at the gauge near 2 am: 3.74’ above the high tide mark (Mean Higher High Water, or MHHW). According to NOAA, this broke the previous all-time water level record of 3.39’ above MHHW set on October 15, 1954, during Category 4 Hurricane Hazel (and tied on September 19, 1955 during Category 2 Hurricane Ione).
Note that sea level in Beaufort has risen by about 0.7 feet since the time of Hazel, largely due to human-caused climate change, and Florence would not have been able to break Hazel’s record without it.
 |
| Figure 3. The history of high-water levels (storm tide) in Beaufort, North Carolina since 1953. Prior to Hurricane Florence, the highest storm tide was during Hurricane Hazel in 1954. Note that sea level in Beaufort has risen by close to 8 inches since Hazel struck. The red line marks a water level that has a 1% chance of occurring per year: a 1-in-100-year event. Florence’s water level would have been a 1-in-100-year event had it occurred in 1954, but now is closer to being a 1-in-50-year event. Image credit: NOAA/NWS/MDL. |
Wilmington and Wrightsville Beach (only about 10 miles apart) were beginning to see the peak storm surge of Florence early Friday afternoon. As the hurricane moved to the west of the city this morning, onshore winds began blowing the surge into shore, and were sustained at 51 – 64 mph for the period 7:42 am – noon EDT Friday. We can expect the Wilmington gauge to achieve a top-five highest water level on record; it is uncertain if it can challenge its all-time high water level of 3.48’, set on October 8, 2016, during Hurricane Matthew (barely ahead of the 3.47’ water level set on October 15, 1954 during Hurricane Hazel).
At Wrightsville Beach, a storm surge of 3.77’ was observed at 10:54 am EDT, and a storm tide of 4.11’. This is the third highest water level on record for the site, behind the 11.72’ on October 15, 1954 during Category 4 Hurricane Hazel, and 8.22’ on September 6, 1996, during Category 3 Hurricane Fran.
Still to come: The worst of Florence’s rains and flood impacts
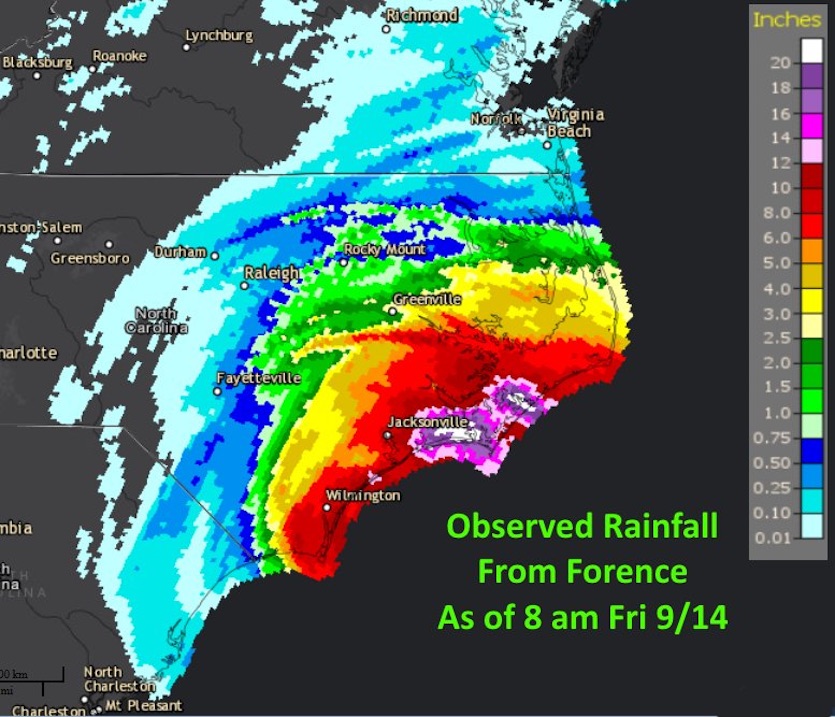
Between its slow motion and its massive size, Hurricane Florence is in the running to be the “Harvey of the East”—the largest rainfall producer of any East Coast hurricane on record. Already, estimates based largely on radar data show that 12” – 20” of rain fell from Thursday to Friday morning in a slice of coastal Carolina within about a 30-mile radius of Beaufort. Some eye-popping totals have come from automated gauges in the area, including Atlantic Beach, but these cannot be considered reliable until verified. Automated gauges have been known to run “hot” during high winds and produce erroneously high values. A reliable storm total of 20.37” came in from Oriental, North Carolina, at midday Friday. The highest manually obtained rainfall total from a trained CoCoRaHS observer as of Friday morning was 14.25", collected about 1.4 miles north of Swansboro in Onslow County.
 |
| Figure 4. Multi-sensor estimate of rainfall from Hurricane Florence through 8 am EDT Friday, September 14, 2018. These estimates are derived from hourly NWS/NEXRAD radar data and available rain gauges, with input from satellite data as needed. Image credit: NWS. |
The pink-hued part of Figure 4 above will be expanding through Saturday as Florence’s rains slowly translate westward. The 12Z Friday run of the HWRF model, which extends out 34 hours (from 8 am Friday though 6 pm Saturday EDT), dumps 12” to at least 24” more rain from Wilmington to Morehead City and inland well past Fayetteville (see Figure 5 below). The HRRR model did an good job of simulating the ballpark of extreme short-term rainfall totals while Harvey was inundating areas near Houston last year. The 3-km high-resolution NAM run from 12Z Friday paints a very similar picture, with the heaviest rains expanding into extreme northeast South Carolina and working their way further inland on Saturday and Sunday. The 3-km NAM predicts that more than 24” of rain will fall from Friday morning to Sunday evening across the southermost swath of North Carolina—an area roughly the size of Delaware.
Frictional convergence & synoptic-scale forcing will keep #Florence on a path along the coast towards Myrtle Beach thru tomorrow. The heaviest rain for southern NC will come on the backside of #Florence via very intense, training rain bands. Not all that dissimilar from #Harvey pic.twitter.com/jkVaAGY600
— Eric Webb (@webberweather) September 14, 2018
It’s certainly possible we will see some locations racking up a storm total from Florence of 40” or more, as warned by the NWS for several days. Such totals would be the highest observed in any U.S. hurricane outside of Texas, Florida, and Hawaii. North Carolina’s state rainfall record from a hurricane is 24.06” from Hurricane Floyd of 1999, South Carolina’s is 17.45” from Hurricane Beryl of 1994 (the previously reported 17.45" from Tropical Storm Jerry in 1995 was found to be erroneously high), and Virginia’s is 27.00” from Hurricane Camille of 1969.
The flash flooding risk will escalate to dangerous levels Friday into Saturday as the rains continue over hard-hit areas and expand westward toward higher terrain. Smaller creeks will hit flood crests throughout the weekend wherever the most intense rains occur. Next week, based on consistent model guidance, all-time record or near-record crests may occur along several rivers in far southern North Carolina by Tuesday and South Carolina by Wednesday or Thursday, including the Cape Fear River north of Wilmington and the Little Pee Dee and Wacamaw Rivers northwest of Myrtle Beach. These larger rivers will be quite slow to recede.
This emerging flood event has ominous echoes of the catastrophes that struck eastern North Carolina during Hurricane Floyd (1999) and Hurricane Matthew (2016). In North Carolina alone, Floyd led to 51 deaths in the state, and Matthew caused 26 deaths. Both storms inflicted more than $1 billion in damage in North Carolina alone.
 |
| Figure 5. Rainfall totals from 8 am Friday through 6 pm Saturday, September 15, 2018, as predicted by the HRRR mesoscale model run from 12Z (8 am EDT) Friday. Image credit: tropicaltidbits.com. |
Mangkhut heads for landfall in the northernmost Philippines; major threat for Hong Kong this weekend
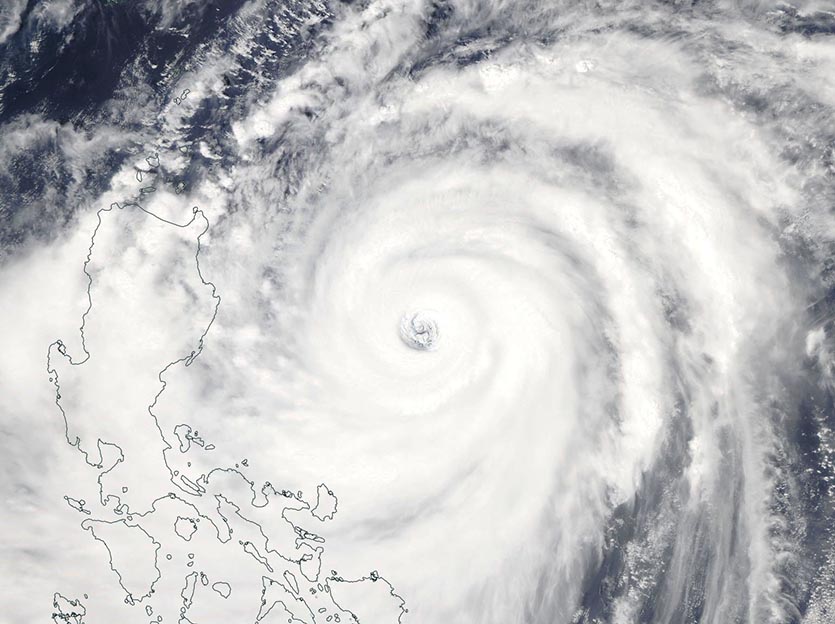
Earth’s strongest tropical cyclone of 2018, Super Typhoon Mangkhut, was approaching the northernmost part of Luzon, Philippines, on Friday night local time as a Category 5-equivalent super typhoon, its top winds shrieking at 165 mph. The Joint Typhoon Warning Center predicts that Mangkhut will strike the northeast coast of Luzon in the predawn hours on Saturday local time. An ongoing eyewall replacement cycle may cut back slightly on Mangkhut’s strength over the next few hours, but a Category 5 landfall appears likely. Northern Luzon is a largely agricultural area, with much less population than Manila and other parts of southern Luzon. As a result, we can expect a major blow to Philippines agriculture, but hopefully a more limited hit on people and infrastructure. Two other typhoons have struck northern Luzon at Category 5 strength in recent years, Megi (2010) and Cimaron (2006). In both cases, damage was less than $300 million and the death toll was less than 35.
 |
| Figure 6. MODIS image of Super Typhoon Mangkhut on Friday afternoon, September 14, 2018. Image credit: NASA Worldview. |
Depending on its state after crossing the mountains of northern Luzon, Mangkhut will have time to recover somewhat as it crosses the South China Sea toward a second landfall on Sunday local time on the southeast coast of China. Because of the angle of approach, a slight path difference could determine whether Mangkhut reaches the coast about 100 miles southwest of Hong Kong, as forecast by JTWC and the Hong Kong Observatory (HKO), or very close to the urban area, as predicted by HWRF. In either case, Hong Kong would experience the more intense right-hand side of the typhoon.
Mangkhut is likely to make landfall as a Category 3- or 4-level storm, so major impacts can be expected along this densely populated coast, especially if Mangkhut veers toward Hong Kong. HKO hoisted its most dire alert level—Warning Flag #1—further ahead of the storm than it has for any storm on record, as noted by the South China Morning News. Hong Kong security minister John Lee Ka-chiu told reporters, “As the wind and rain brought by Mangkhut are expected to come in extraordinary speed, scope and severity, I have ordered all parties to prepare for the worst.”
Jeff Masters co-wrote this post.


