| Above: Visible satellite image of Tropical Storm Barry at 1500Z (11 am EDT) July 14, 2019. At the time, Barry was a minimal tropical storm with 40 mph winds. Image credit: NOAA/RAMMB. |
Long-awaited rainbands from Tropical Storm Barry were streaming northward across the lower Mississippi Valley on Sunday. The region was plastered with flash flood watches. Barry’s rains are now unlikely to match the catastrophic levels originally predicted and feared, but widespread flash flooding is still expected. The rains will also help extend the most prolonged flood on record across parts of the mid- and lower Mississippi River.
 |
| Figure 1. Rainfall forecast for Barry for the five-day period starting at 8 am EDT Sunday, July 14, 2019. Image credit: NOAA/NWS/WPC, via NHC. |
At 11 am EDT Sunday, Barry’s center was located about 50 miles south-southeast of Shreveport, Louisiana, moving north at 9 mph. Barry was a minimal tropical storm, with top winds of just 40 mph, and will weaken to a depression by Sunday night and a remnant low by Tuesday or sooner as it arcs across western Arkansas and into Missouri. Most of the heavy rains from Barry will occur well east of its center. The NOAA/NWS Weather Prediction Center has kept a high risk of excessive rainfall over south-central Louisiana from Sunday into early Monday, with a moderate risk covering the Mississippi Delta region as far north as Memphis.
For more on Barry’s impacts, see the frequently updated weather.com roundup.
 |
| Figure 2. Observed 7-day precipitation amounts ending at 8 am EDT Sunday, July 14, 2019. Barry dropped rainfall amounts in excess of five inches (red colors) over south-central and southeast Louisiana, plus coastal Alabama. Image credit: NOAA/NWS/AHPS. |
What happened with the rain?
One of the most relieving yet puzzling aspects of Barry is how little rain the storm has produced onshore. Up through Sunday morning, Barry’s heaviest rains were limited to pockets of coastal Louisiana, Mississippi, and Alabama, where 5” to as much as 8” fell (see Figure 2). Amounts were mostly 1” to 3” elsewhere across eastern Louisiana and southern Mississippi. More rain is still expected, of course, as detailed above.
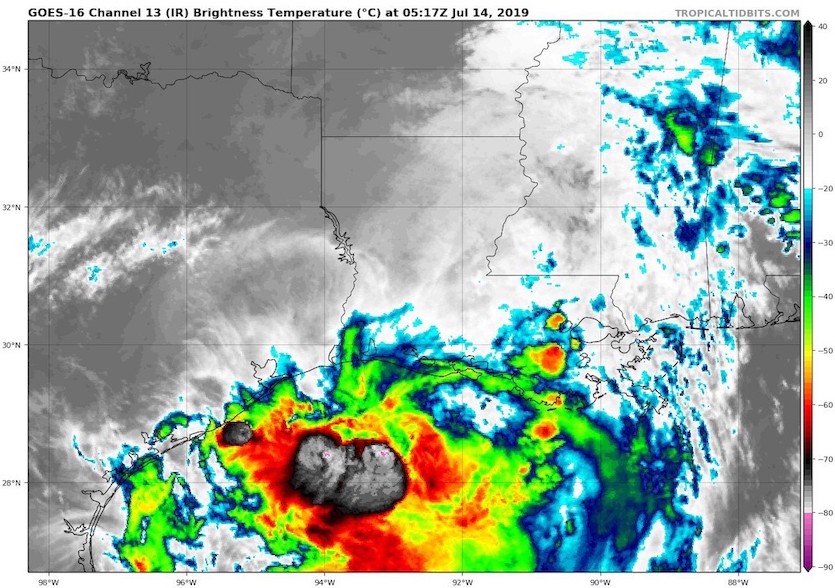
If you didn’t already know, you might be astonished to learn that Barry is well inland when you look at an infrared satellite image from early Sunday morning. The coldest cloud tops, which correspond to the most intense thunderstorms (as their updrafts extend to colder, higher reaches of the atmosphere), are still almost all offshore, making it look as if Barry itself is still at sea. Some of the rainbands already arcing across the Lower Mississippi Valley don’t appear or look weaker because these are shallower features with lower, warmer cloud tops; they are still capable of producing very heavy rain, but aren’t as intense as the offshore convection.
 |
| Figure 3. Infrared satellite image from Barry at 0517Z (1:17 am EDT) Sunday, July 14, 2019. Image credit: tropicaltidbits.com. |
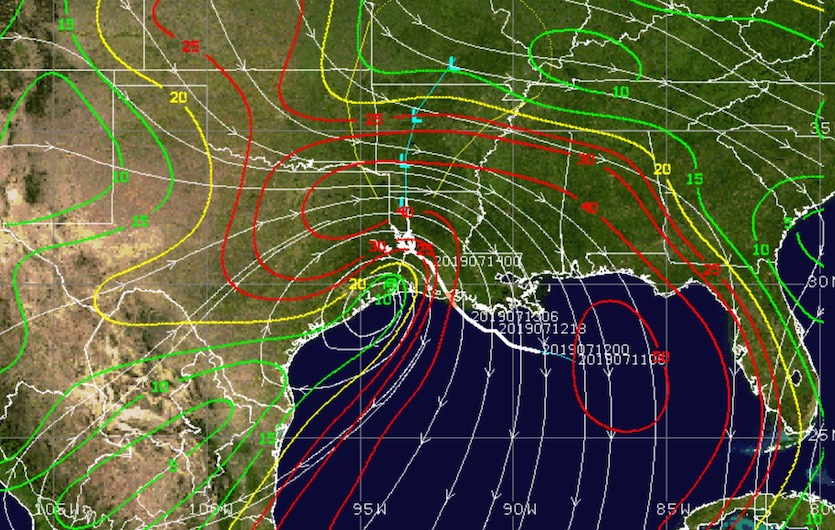
We don’t yet know exactly why Barry’s inland rains have been later and weaker than expected, but one piece of the puzzle is the strong northerly winds that have impeded Barry from the outset. The northerly winds created strong wind shear and pushed dry air into Barry’s north side and led to a tilted system, with a broad, complex surface low near the coast and a mid- and upper-level circulation well to the south (further offshore). This somewhat unusual configuration resulted in Barry’s mid-level circulation sitting atop very warm, moist air and the very warm waters of the northern Gulf, boosting instability and spawning extremely intense convection well south of Barry’s surface center. Meanwhile, the atmosphere to the north of Barry’s center remained less moist and less unstable, and it’s possible that outflow from the persistent offshore storms further impeded the growth of inland convection.
It’s surprising that even our best computer models failed to pick up on how much this evolution would cut back on potential inland rainfall through at least early Sunday. The models did convey that wind shear could be an issue, and for several days model ensembles called for a sharp west-to-east dropoff in rainfall close to the New Orleans area. Tropical meteorology researchers will have much to learn from this fascinating case study.
 |
| Figure 4. Strong northwest to northerly wind shear between 850 and 200 mb (roughly 5000 to 38,000 feet) persisted on Sunday morning, July 14, 2019, across the east side of Barry’s circulation. Image credit: CIMSS/SSEC/UW-Madison. |
Storm surge: largely as predicted
Overall, the storm surge from Barry came in much closer than rainfall to forecast expectations. Barry’s peak storm surge hit on Saturday, with the highest storm surge of 7.0 feet recorded midday Saturday, July 13 at Amerada Pass in south-central Louisiana. A 5-foot storm surge moved up the Atchafalaya River at Berwick, south of Morgan City. The surge was nearly 3 feet at Morgan City, pushing the river to its third highest level on record. The only higher floods occurred when the Morganza floodway was activated to alleviate Mississippi River flooding in 1973 and 2011. Note that spring flooding also sent the river to its fifth highest level on record back on March 15.
 |
| Figure 5. Observed and predicted heights of the Atchafalaya River at Morgan City, Louisiana. A storm surge of nearly 3 feet brought the river to 10.06’, its third highest level on record. Flood walls protect the city to a flood height of 17’. Image credit: NOAA. |
Barry’s peak surge of 3 - 4 feet in southeast Louisiana resulted in multiple levee overtopping events. One caused a mandatory evacuation for about 400 residents in Terrebonne Parish along Louisiana 315 and Brady Road south of the Salgout Canal Road, due to extended overtopping of a four-mile section of the Lower Dularge East Levee. Another levee overtopped in several places in Plaquemines Parish. It is one of two in the parish not reinforced in the wake of Hurricane Katrina, although funding was allocated for the levee. High water also overtopped levees on the north side of Lake Pontchartrain, in the Mandeville area, resulting in some localized flooding.
Storm surge only produced a 1-foot rise on the Mississippi River at New Orleans, 3 feet below the height of the river levees. The Mississippi is expected to remain unusually high for weeks to come, though, so it will need to be monitored if another hurricane happens to take aim at southeast Louisiana in the coming weeks. See the post from Jeff Masters for more on how even a Category 1 hurricane could produce a destructive surge up the Mississippi.
 |
| Figure 6. Two people sit on a park bench along Lakeshore Drive on the shore of Lake Pontchartrain after the area flooded in the wake of Hurricane Barry on July 13, 2019 in Mandeville, Louisiana. Hurricane Barry’s storm surge overtopped levees in Mandeville, causing localized flooding. Image credit: Scott Olson/Getty Images. |
Barry’s storm surge on Dauphin Island, Alabama brought flood waters 1 to 2 feet deep on Saturday, and deposited 2 to 3 feet of sand.
Here are the peak storm surge values recorded by NOAA gauges, in feet above normal tide levels:
—Amerada Pass, LA: 7 feet
—Berwick, LA: 6.7 feet
—Eugene Island: 6.1 feet
—Bonnet Carre Floodway at Lake Pontchartrain (near LaPlace): 4.4 feet
—Freshwater Canal Locks (Vermillion Parish): 3.7'
—New Orleans (New Canal Station on Lake Pontchartrain): 3.5 feet
—Shell Beach, LA: 3.5 feet
—Grand Isle, Louisiana: 3.1 feet
—Waveland, Mississippi: 3.1 feet
—Pascagoula, MS: 2.1 feet
—Dauphin Island, Alabama: 2 feet
Potential rainfall records to watch for
It’s still possible that Barry will set one or more all-time July records for one- or two-day rainfall. Below are the one- and two-day July records for selected cities, with the two-day records ending on the date shown. Records begin for each city on the year shown after the city name. The New Orleans data are only for the interntational airport site.
Baton Rouge, LA (1892) 6.33 (7/15/1914) 9.98 (7/15/1914)
Lafayette, LA (1893) 5.66 (7/29/1954) 6.92 (7/29/1954)
New Orleans, LA (1946) 4.32 (7/8/1996) 5.34 (7/20/2012)
Jackson, MS (1896) 5.45 (7/26/2001) 6.59 (7/27/2001)
Tupelo, MS (1930) 6.30 (7/3/2015) 8.03 (7/4/2015)
Natchez, MS (1892) 4.68 (7/7/1911) 6.78 (7/7/1911)
Memphis, TN (1872) 4.56 (7/12/2010) 5.56 (7/13/2010)
Little Rock, AR (1875) 5.69 (7/31/1902) 6.95 (7/31/1902)
Dr. Jeff Masters co-wrote this post.


