| Above: Flames from a backfire consume a hillside as firefighters battle the Maria Fire in Santa Paula, Calif., on Friday, Nov. 1, 2019. Image credit: AP Photo/Noah Berger. |
More bouts of critical wildfire risk may be in store for parts of California throughout the coming month and well into December, according to the latest forecast models together with outlooks from fire agencies. The El Niño/Southern Oscillation (ENSO) may get into the mix this winter.
“A weather pattern which favors offshore winds occurring over fuel beds that are primed for burning will lead to above to well above normal large fire potential through November. Southern [California] may not see any lowering of large fire potential until late December,” said the Southern California Regional Coordination Center (SCRCC) in a strongly worded outlook issued on Friday and valid through February. The center added: “Offshore winds may lead to periods of critically high fire potential over Southern California the next few weeks.”
 |
| Figure 1. The National Wildland SIgnificant Fire Potential Outlook for November (left) and December 2019 (right) shows a greater-than-normal threat for significant wildfires across parts of California. Image credit: National Interagency Fire Center. |
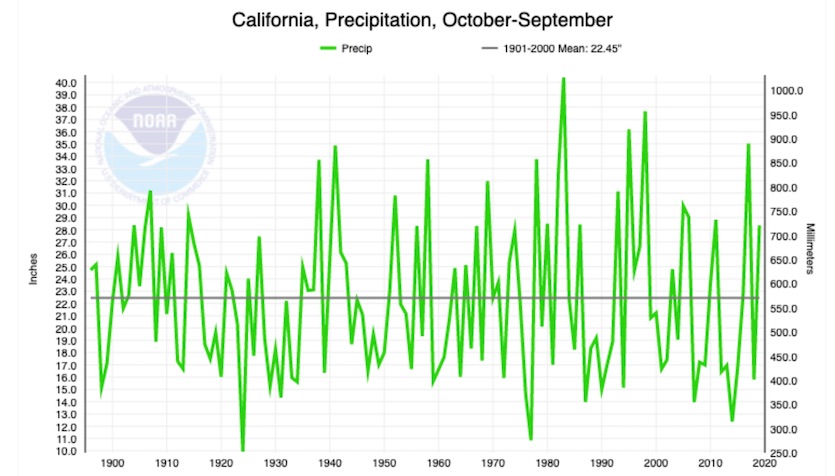
Generous rains and mountain snows fell across California in the water year that ended on September 30. The 12-month statewide precipitation average was 28.36”, the 21st highest in 124 years of recordkeeping. The moisture helped keep fires largely at bay through the summer, but it also fed the growth of grasses and shrubs that have since dried out after months without rainfall. The 2019-20 wet season has yet to arrive, which isn’t helping.
 |
| Figure 2. California statewide precipitation for water years (October-September) from 1895-96 to 2018-19. Image credit: NOAA/NCEI. |
We’re now entering the time of year when fire-stoking Santa Ana winds in and near the coastal stretch from Santa Barbara to San Diego are typically at their strongest and most frequent. That poses a real problem if winter rains haven’t yet arrived. In Los Angeles and Ventura counties, each year brings an average of 60 days with Santa Ana conditions, according to the SCRCC. Half of those days occur from November through January—a period that also includes, on average, 10 of the 17 days with moderate or stronger Santa Ana conditions.
Offshore wind events ramped up dramatically this past October, as high pressure aloft strengthened its grip off the Pacific Coast while intense upper-level storm systems pushed into the central states. The low-level air masses that pushed across California weren’t exceptionally warm, but they were extremely dry, which led to very low relative humidities and poor conditions for firefighting. A well-publicized series of cautionary power shutoffs by Pacific Gas & Electric affected millions of Californians. Some PG&E lines were still associated with fire starts, but it’s also possible the shutdown, problematic as it was, kept other fires from starting.
For whatever reasons, California's fires this year thus far have been far less widespread and destructive than their counterparts in 2017 and 2018, as shown in the tweet below. Those two years each had three fires that each destroyed more than twice as many structures as all of California’s major fires this year so far. The Maria Fire, which took off from Halloween night into November 1, had consumed 9412 acres and two structures as of Monday morning and was 80% contained.
Updated table highlighting the last three years of major #California wildfires & the number of destroyed structures. Data as of November 1 AM. pic.twitter.com/KzeSYMjBxr
— Steve Bowen (@SteveBowenWx) November 1, 2019
According to Cal Fire, three of California’s ten most destructive fires on record have occurred in November and December—and all three of those were in 2017 and 2018. They include the Camp Fire (November 2018, Butte County; 18,804 structures), the Woolsey Fire (November 2018, Ventura County, 1643 structures), and the Thomas Fire (December 2017, LA and Ventura counties, 1063 structures), which is also the state’s second largest fire in modern records.
Three of the state's ten deadliest fires occurred in November: the Camp Fire, which took 85 lives, as well as the Loop Fire (November 1966, LA County, 12 deaths) and the Inaja Fire (November 1956, San Diego County, 11 deaths).
Californians may have gotten off relatively easy in 2019 thus far compared to 2017 and 2018, but the cumulative experience of power cuts, evacuations, smoky skies, and torched landscapes is taking a clear psychic toll. Veteran climate writer and activist Bill McKibben captured the feeling in a Guardian article called “Has the climate crisis made California too dangerous to live in?” As McKibben shows, this decade’s assault by fire in California and its links to climate change are tapping into very real concerns and deep fears.
I dearly love my native state of California; the thought that parts of it may now be 'too dangerous to inhabit' scares and saddens me. And where it goes, many other places will follow. We've simply got to slow down the climate crisishttps://t.co/t2xWzMOE63
— Bill McKibben (@billmckibben) October 29, 2019
Bioclimatologist A. Park Williams (Lamont-Doherty Earth Observatory at Columbia University) summarized the connections between human-caused climate change and California’s fire in the AGU journal Earth’s Future this summer. “The ability of dry fuels to promote large fires is nonlinear, which has allowed warming to become increasingly impactful,” said Williams. “Human‐caused warming has already significantly enhanced wildfire activity in California, particularly in the forests of the Sierra Nevada and North Coast, and will likely continue to do so in the coming decades.” In a recent New York Times interview, Columbia’s Adam Sobel looks at the multiple factors—including climate change—that have fed into California’s evolving fire crisis.
Some of the physical damage from this year’s fires isn’t as easy to capture in a visual as, say, the horrifying destruction of Paradise, California, in a 2018 fire. The Los Angeles Times explored how the recent Kincade Fire may have taken a surprising toll on the namesake industry of California’s wine country.
“For the most part, vines and wineries survived the flames, and, as of Saturday night, the blaze was 74% contained,” the Times noted. “But questions loom over how much of the 2019 vintage survived a week of intense heat, smoke and evacuation-caused neglect. How big an economic hit the region’s small, family-owned operations will take. And whether the wine country’s carefully cultivated image can survive year after year of increasingly destructive fires, which are reshaping how the world views this region of rolling hills, orderly beauty, popping corks and clinking glasses.”
 |
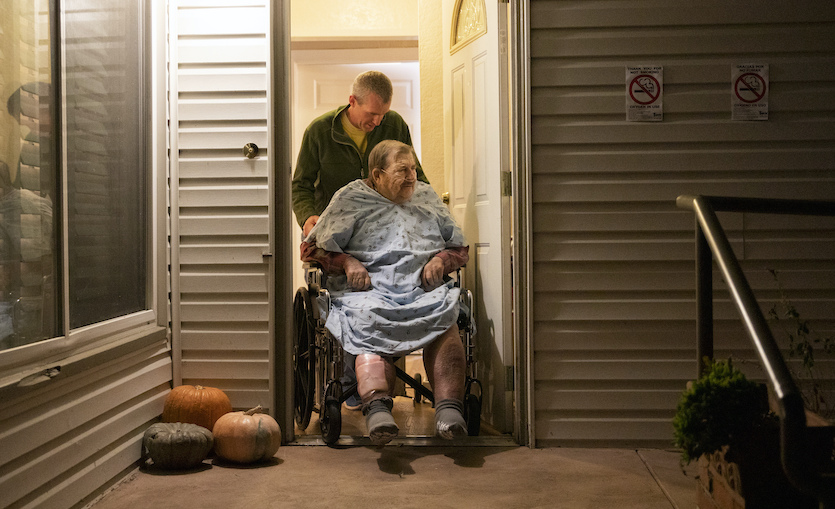
| Figure 3. Henry Provencher, 87, is wheeled out of Redwood Retreats, a residential care facility by owner Eric Moessing while evacuating due to the Kincade Fire in Santa Rosa, Calif., on Saturday, Oct. 26, 2019. The evacuation order encompassed a huge swath of wine country stretching from the inland community of Healdsburg west through the Russian River Valley and to Bodega Bay on the coast, Sonoma County Sheriff Mark Essick said. Image credit: AP Photo/Ethan Swope. |
The outlook for early November: dry as dust
There’s no sign that winter rains will be making a robust appearance anytime soon. The Monday-morning (12Z) runs of the GFS and European models show no measurable precipitation anywhere in California for at least the next ten days. The 8-14 day extended outlook from the NOAA/NWS Weather Prediction Center is similarly gloomy.
In downtown Los Angeles, where precipitation records go back to 1877, only 16 years have made it from October 1 to November 4 without even a trace of rain. Just four of those years made it to November 15 without a single drop; if forecast models prove correct, 2019 may become the fifth. Only two years—1891 and 1980—have gotten from October 1 to November 30 without at least a trace of rain in downtown Los Angeles.
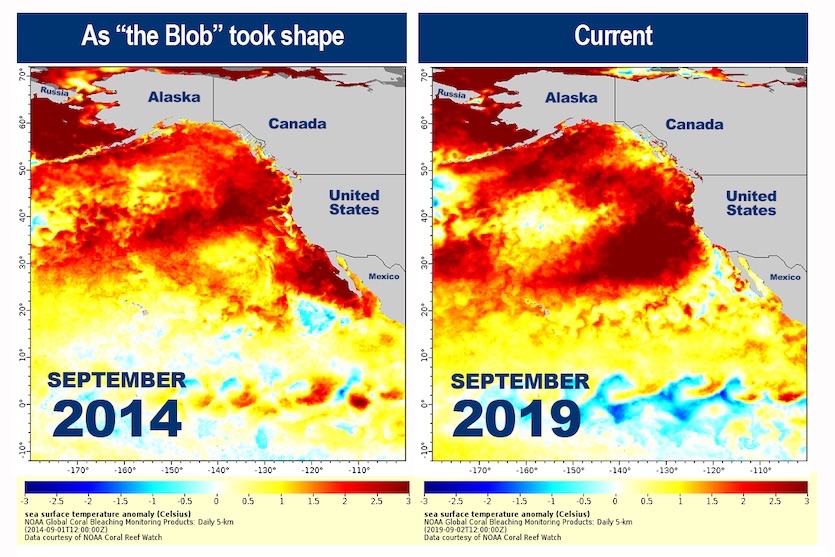
The dry pattern across the Southwest is now acting in concert with unusually warm sea surface temperatures (SSTs) that extend throughout the northeast Pacific. It’s an unwanted reprise of “The Blob,” an expansive zone of warm SSTs in roughly the same area during the mid-2010s. Weather patterns associated with The Blob helped to reinforce California’s brutal six-year drought from 2010 to 2016, and it appears the atmosphere and ocean are now again in sync.
 |
| Figure 4. A comparison of sea surface temperature anomalies (departures from the seasonal average) in the Northeast Pacific in September 2014 (left) versus September 2019 (right). Image credit: NOAA Fisheries. |
“Now that the ridge has been parked over the Eastern Pacific in close alignment with the area of greatest positively anomalous SSTs, it may [be] some time before this pattern breaks down,” said the SCRCC in its November 1 outlook. “There has been a tendency the past few years for these Eastern Pacific ridges to ‘lock in’ with warm SSTs in a pattern which favors prolonged periods of warmer- and drier-than-normal weather.”
Climate change may erode California’s traditional wet seasons at either end, leading to delayed onsets like we’re now seeing as well as premature endings, according to research led by Daniel Swain (UCLA/NCAR). See our 2018 post on this work, which used an ensemble of climate models to find that the typical California wet season may become shorter but more intense, leaving the state more prone to drier, warmer, more fire-prone autumns as well as extreme winter floods. Year-to-year variability may be amped up as well.
According to Swain, changes in the long-term yearly average alone can obscure important year-to-year variability. “Folks would say, ‘There’s no real trend in annual precipitation in the observational record and in climate model simulations, even under pretty significant warming, so what can we say about drought?’ With our approach, we can see that the mean trend masks all the interesting changes that are going on at opposite ends of the precipitation spectrum.”
 |
| Figure 5. Trends over the past year in departures from average sea surface temperature across the four regions typically monitored to track the El Niño/Southern Oscillation. Image credit: NOAA/CPC. |
Modoki in the works?
SSTs in the benchmark Niño3.4 region have nosed their way up to 0.7°C above average, according to NOAA’s weekly ENSO report issued Monday. That’s high enough to qualify as a weak El Niño if it were to continue above the threshold of +0.5°C for a few months. At the same time, colder-than-average waters are persisting just off the coast of South America, while the central equatorial Pacific has been warmer than average throughout the past year. These ingredients match up nicely with El Niño Modoki, an equatorial surface warming that’s shifted more toward the central as opposed to the eastern Pacific. A warm pulse moving across the Pacific over the last few weeks is associated with a strong Kelvin wave; we’ll have to see if the warmth persists after the Kelvin wave has passed.
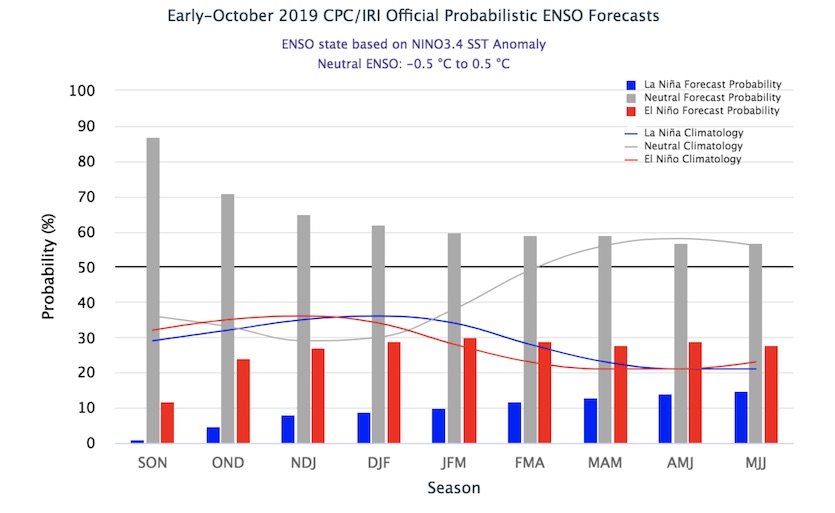
Odds of an El Niño developing this northern winter are low but nonzero—about 20 to 30%, according to the monthly forecasts issued in October by NOAA and the International Research Institute for Climate and Society (IRI). ENSO was considered to be in a neutral state as of NOAA’s last monthly discussion (October 10).
 |
| Figure 6. Probabilistic forecast for ENSO’s evolution across overlapping three-month periods from this autumn into 2020, created in early October 2019. Image credit: NOAA/IRI. |
An El Niño Modoki might not be good news for California, as there’s evidence that the westward-shifted Modoki pattern is less reliably wet for Southern California than a more classical strong El Niño event. This may be one reason why the record-strength 2015-16 El Niño didn’t bring the moisture that SoCal was expecting and longing for, according to a study published in Climate Dynamics last month and led by Christina Patricola (Lawrence Berkeley National Laboratory, or LBNL). Two other similarly strong El Niño events, 1982-83 and 1997-87, doused Southern California with heavy rains, but the 2015-16 event had much more of an Modoki flavor, as documented by NOAA’s Michelle L’Heureux.
Classifying El Niño by a single index, such as Niño3.4, leaves out nuance that may be hugely important for such consequences as precipitation in California. Patricola and LBNL colleague Ian Williams have created the ENSO Longitude Index, which is keyed to the average longitude across the equatorial Pacific at which SSTs are warmer than the average for the global tropics. Such regions are where upward motion associated with intense showers and thunderstorms (convection) should be most prevalent. This upward motion tends to reverberate through the atmosphere, causing the downstream effects thousands of miles away that are associated with El Niño.
“We quantified this longitude and found that it compactly characterizes the diversity of ENSO events, clearly indicates extreme El Niño events (like 1982–1983 and 1997–1998) that produce the greatest impacts on global climate, and performs as well as existing indices in revealing the remote climate impacts of ENSO,” said Williams and Patricola. “Widespread adoption of this practical new index will simplify model evaluation of ENSO and more effectively monitor and communicate the state of the coupled climate system.”


