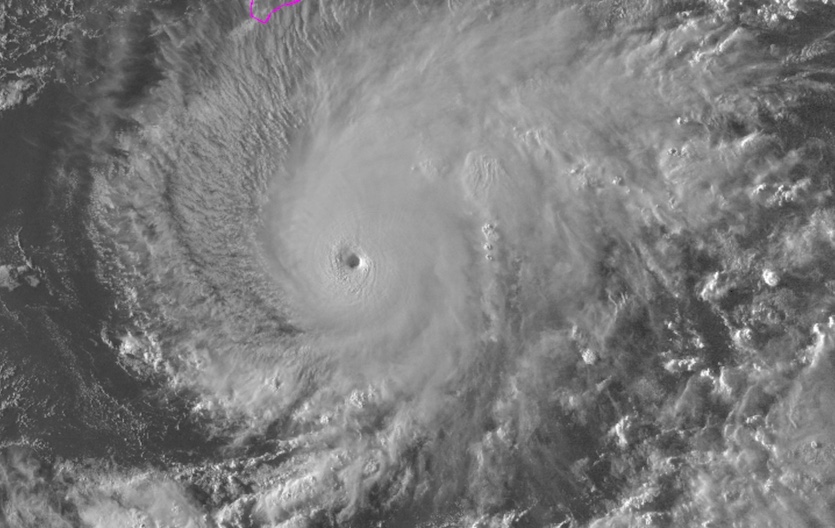
| Above: Enhanced infrared image of Hurricane Lane at 0400Z Wednesday, August 21, 2018 (midnight Tuesday night EDT). The southernmost part of the Big Island is outlined in pink at top center. Image credit: NOAA/NESDIS. |
Growing ever more organized on Tuesday night, Hurricane Lane reached Category 5 strength as it continued rolling toward the Hawaiian Islands. A hurricane warning was issued at 5 pm HST (11 pm EDT) Tuesday for Hawaii’s Big Island, with watches extending from Maui to Oahu, including Honolulu and the islands of Lanai, Molokai, and Kahoolawe. Watches and warnings will continue to evolve on Wednesday and beyond. Governor David Ige declared a state of emergency on Tuesday to facilitate rapid state response to the threat posed by Lane.
Update (11 am EDT Wednesday): At 5 am HST (11 am EDT) Wednesday, Lane had weakened slightly to top-end Category 4 strength, with top sustained winds of 155 mph. A hurricane watch is now in place for Oahu and Kauai, with hurricane warnings in place for Hawaii and Maui counties, including the Big Island, Maui, Lanai, Molokai, and Kahoolawe. We will have a new post with additional details shortly.
The NOAA/NWS Central Pacific Hurricane Center upgraded Lane to Category 5 storm in a special advisory at 6:20 pm HST Tuesday (12:20 am EDT Wednesday), with top sustained winds near 160 mph and a minimum central pressure of 940 mb. As of 6:30 pm HST, Lane was located about 375 miles south-southeast of Kailua-Kona on the Big Island’s west coast, heading west-northwest at 9 mph.
 |
| Figure 1. A spectacular sunset view of Hurricane Lane in visible-wavelength satellite imagery collected at 0330Z Wednesday, August 21, 2018 (5:30 pm HST and 11:30 pm EDT Tuesday). Image credit: NOAA/NESDIS. |
Lane intensified steadily through the day Tuesday, with its central pressure dropping from 940 mb at 2 pm EDT to 929 mb by 11 pm EDT. Data from a reconnaissance flight on Tuesday night showed that Lane was strengthening even further, with an extrapolated central pressure of 922 mb and an SFMR surface wind estimate of 152 knots (175 mph) reported just before midnight EDT.
This remarkable bout of intensification won't go on forever, and fluctuations in Lane’s intensity can be expected on Wednesday, which could easily be enough to bring Lane back below the Category 5 threshold. Regardless, the key message is this: Lane is a formidable hurricane and should remain so through the day on Wednesday. The 0Z Wednesday run of the SHIPS model indicates that wind shear will not increase significantly over Lane until at least Thursday morning, and sea surface temperatures will remain in the 27-28°C range (81-82°F), so these should not induce any major weakening on Wednesday.
The timing of eyewall replacement cycles is difficult to predict, but if one happens to take place on Wednesday, which is quite possible, Lane’s strength could drop by roughly a Saffir-Simpson category for roughly a day. In this case, the hurricane might run out of time to return to its previous peak strength before drawing closer to the islands.
 |
| Figure 2. In records going back to 1851, only five hurricanes before Lane were known to have reached Category 5 strength while prowling the central Pacific: Patsy in 1959; Emilia, John, and Gilma, all in 1994; and Ioke in 2006. None of these brought Category 5 conditions any closer than Lane to Hawaii. Many hurricanes went undersampled or underreported before the era of satellite monitoring. Image credit: NOAA Historical Hurricane Tracks, courtesy Jon Erdman, weather.com. |
Track and intensity forecast for Lane
There were no huge changes on Tuesday night in the general outlook for Lane detailed in our Tuesday afternoon post. The forecast for Lane remains exceptionally challenging, though, given that:
• Lane is extremely strong for its location. Only a handful of major hurricanes are known to have passed within striking distance of the Hawaiian Islands.
• Lane is predicted by CPHC to veer toward the north-northwest, bringing it to within around 100 miles of the Big Island’s west coast on Thursday afternoon (perhaps closer or farther away) as a Category 3 hurricane. Lane is then predicted to carry out a counterclockwise loop that roughly parallels the island chain, perhaps coming quite close to Oahu by Friday and Kauai by Saturday as a weakening hurricane or tropical storm. The counterclockwise loop greatly complicates the impact of even a slight error in track, in much the same way that a slight east or west displacement of a hurricane moving north along Florida’s east or west coast can have huge implications for weather on the ground.
• Lane’s counterclockwise loop is likely to track near or just to the left of several of the islands, which would put them on the more dangerous right-hand side of the hurricane even if no landfalls occurs.
 |
| Figure 3. Forecast track and “cone of uncertainty” for Lane as of 6 PM HST Tuesday, August 20, 2018 (midnight Tuesday night EDT). The cones are constructed based on typical forecast errors over the past few years such that a hurricane can be expected to fall within the cone about two-thirds of the time. The cone suggests that Lane could remain well west of the Big Island—or could make landfall on the west coast. Image credit: NOAA/NWS/CPHC. |
• There are no close analogs in modern hurricane history for Lane’s combined track and strength.
• Hawaii’s hurricane experience is limited. Only two direct hurricane landfalls have been recorded in Hawaii, both on Kauai: Category 1 Dot in 1959 and catastrophic Category 4 Iniki in 1992. (While Category 1 Iwa in 1982 had major impacts in Kauai, its eye did not make landfall on the island.) This means that awareness and preparation procedures are not powered by habit and experience as they are in such places as Texas, Florida, and the Carolinas.
• Although a gradual increase in wind shear is likely to weaken Lane from Thursday onward, the hurricane is likely to be expanding at the same time, so winds of tropical-storm strength may cover an ever-broadening swath. In fact, there is a better-than-even chance that such winds will affect nearly all of the Hawaiian islands at some point. Such winds can be enough to bring down trees and power lines, especially after soils are saturated by heavy rain.
The bottom line: It is still too soon to predict with confidence whether Lane will make landfall on one or more of Hawaii’s islands. A landfall will not be required for significant and possibly widespread impacts from torrential rains, landslides, and hurricane- or tropical-storm-force winds that could knock down trees and power lines and damage roofs.
For more on predicted and potential impacts from Lane, see the frequently updated weather.com article.
Track forecast reminders. Forecast changes for #Lane during past couple of days exemplify why there’s a cone of uncertainty around track line; Oahu and Maui in cone since Sunday night. A #hurricane is not a point; dangerous wind and water conditions could happen outside the cone.
— Dr. Rick Knabb (@DrRickKnabb) August 22, 2018
The storm-surge threat from Hawaiian hurricanes
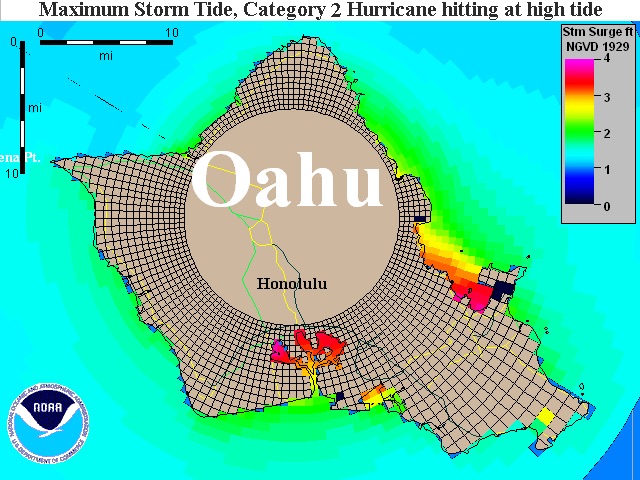
Wind damage and flash flooding from torrential rains are the main threats from hurricanes in the Hawaiian Islands. Storm surge is less of a threat compared to Atlantic hurricanes hitting the U.S. coast, since the Hawaiian Islands are surrounded by deep water that prevents a storm surge from building to large heights. The worst-case surge from a mid-strength Category 2 hurricane hitting Oahu, for example, is only four feet in Pearl Harbor, which is the most vulnerable portion of Oahu to storm surge (see image below).
 |
Figure 4. Maximum of the "Maximum Envelope of Waters" (MOM) storm tide image for a composite maximum surge for a large suite of possible mid-strength Category 2 hurricanes (sustained winds of 105 mph) hitting at high tide along the coast of Oahu, Hawaii. What’s plotted here is the storm tide—the height above ground of the storm surge, plus an additional rise in case the storm hits at high tide. Empty brownish grid cells with no coloration show where no inundation is computed to occur. Inundation of up to 4 feet can occur in a worst-case scenario in Pearl Harbor on the south coast, and in Kaneohe Bay on the northeast coast. Note that not all sections of the coast would experience this surge level simultaneously. |
The image above was created using the National Hurricane Center’s Sea, Lake, and Overland Surge from Hurricanes (SLOSH) model. This model divides the U.S. coast up into 20 or so separate grids (called basins) that storm surge simulations are performed for. If one takes the maximum the water reaches at any point in time at every grid cell in a SLOSH basin, a composite "Maximum Envelope of Water" (MEOW) plot can be made. MEOW plots are created for every category of storm moving in a particular direction, usually stratified by forward speed and tide elevation. Simulations are run using a variety of storm sizes.
If one takes the maximum storm surge height for all the MEOW plots at every grid cell, one can generate a worst-case storm surge for the coast for each Saffir-Simpson hurricane category: 1, 2, 3, 4, and 5. These so-called "Maximum Of the MEOWs", or "MOMs" are what are plotted in the SLOSH storm surge images on wunderground, and are the composite worst-case scenario storm surges from about 15,000 different hypothetical hurricanes for each SLOSH basin. All of the MOM images we provide are for high tide, and were performed using the 2009 version of the SLOSH Display Package provided to wunderground by NOAA. Interstate highways are the thick grey-green lines, and smaller highways are shown as dark green and light green lines. If a road is inundated by storm surge, it will not appear. County boundaries are shown in red.
Dr. Jeff Masters co-wrote this post. We’ll have more on Lane in our next update on Wednesday.


