| Above: Fire crews wait at a property along Putty road as the fire front approaches on November 15, 2019 in Colo Heights, Australia. Bushfires ripped across southern and eastern Australia throughout November. The nation saw its driest and fifth warmest spring (September – November) on record. Image credit: Brett Hemmings/Getty Images. |
Last month was the second warmest November in 140 years of recordkeeping, reported NOAA’s National Center for Environmental Information (NCEI) in its November summary of global climate. The November warmth enhances the likelihood that 2019 will be the second warmest year in global records dating back to 1880.
Only November 2015 was warmer than last month, by just 0.09°C (0.16°F), said NOAA. The third warmest November, in 2013, was 0.11°C (0.2°F) cooler than last month. The six warmest Novembers have all occurred in the 2010s, according to NOAA.
NASA also put November in second place for global warmth, as did the Japan Meteorological Agency. Slight differences sometimes occur in monthly and yearly rankings for global temperature based on how the agencies analyze data-sparse regions such as the Arctic. Copernicus EU placed November in a statistical tie with 2015 and 2016 for warmest November on record.
For the lowest five miles (eight kilometers) of the atmosphere, global satellite-measured temperatures in November 2019 were the warmest in 42 years of monitoring, according to the University of Alabama Huntsville (UAH) and RSS.
 |
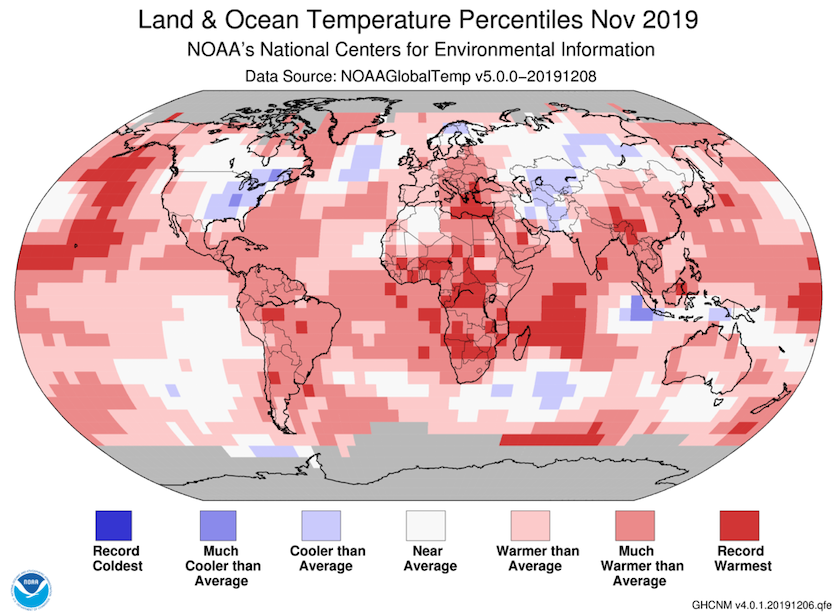
| Figure 1. Departures from average temperature for areas spanning five degrees in longitude and latitude for November 2019. Image credit: NOAA/NCEI |
Residents of central and eastern North America won’t be surprised to learn that they were among the coolest parts of the planet in November relative to average for the month. In fact, the only land areas on Earth that ranked “much cooler than average” in NOAA’s analysis were part of the mid-Mississippi Valley and southern Quebec.
Meanwhile, conditions much warmer than average encompassed most of South America, Africa, Australia, eastern Europe, the Middle East, and southern and eastern Asia. Many areas of record warmth occurred in these continents.
2019 heading toward second place for global warmth
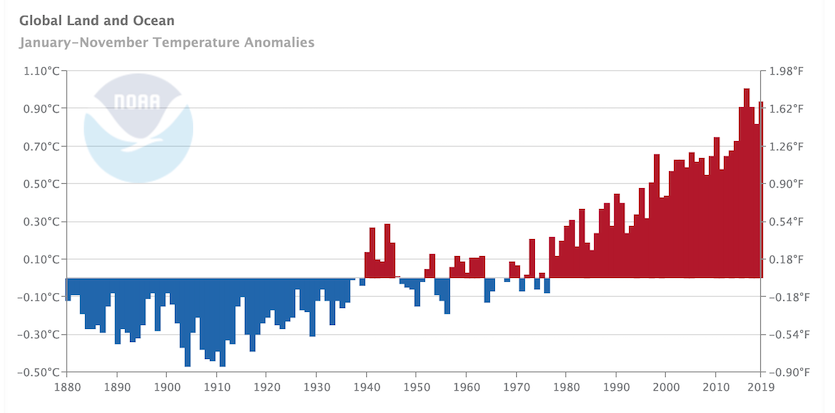
For the months January through November, 2019 also ranks in second place, just 0.07°C (0.13°F) behind 2016. With one month left to go, 2019 looks very likely to end up in the same place—the second warmest year behind 2016 in global records that go back to 1880—and very unlikely to beat 2016. If temperatures are unexpectedly cool in December, this year could end up close to 2015 and 2017, which are currently tied for second warmest year.
NOAA is now able to set odds on where a given year is likely to end up in the global temperature rankings, by using a statistical analysis of how much global temperatures have varied from month to month in the historical record.
In its November diagnosis, NOAA assigned these odds for 2019:
- Less than 0.01% chance of warmest year
- Greater than 99.9% chance of a top 5 year
- Greater than 99.9% chance of a top 10 year
- A 95% chance of second to third warmest year on record
 |
| Figure 2. Global temperature anomalies (departures from average) in the period January-November from 1880 to 2019. Image credit: NOAA/NCEI |
It’s especially striking that 2019 is running so warm given that El Niño has been classified as “neutral” during the second half of the year after a weak El Niño event concluded in mid-2019. Gglobal temperature records are most often set during El Niño years, when a pulse of warmth is added to the atmosphere from warm surface waters spreading across the eastern tropical Pacific. These naturally occurring El Niño events happen on top of longer-term warming from human-produced greenhouse gases, thus leading to global record heat.
Sea surface temperatures (SSTs) over the region typically used to diagnose El Niño (Niño3.4) have been running near or just below the threshold for an El Niño event. However, SSTs have been substantially warmer in the central tropical Pacific, west of the Niño3.4 region, which raises the possibility of an El Niño Modoki event in early 2020. The effects of El Niño Modoki vary from those of a classic El Niño because of the displacement in the warmest waters.
The monthly probabilistic forecast issued in early December by NOAA and the International Research Institute for Climate and Society (IRI) calls for a 25-30% chance of El Niño for the entire period from late 2019 into mid-2020, which is close to the climatological average. The odds of a La Niña event are very low this winter but rise to about 20% by next summer. Neutral conditions remain the most likely outcome into next summer, according to NOAA and IRI.
All-time national and territorial heat records: second most on record
As of December 15, all-time high temperature records have been tied or broken in 21 of the world’s nations and territories, making 2019 the second most prolific year on record for all-time national heat records. The largest number of all-time national/territorial heat records set or tied in a single year was the 22 heat records that occurred in 2016, according to international records researcher Maximiliano Herrera; 2017 holds third place with 14 heat records.
For more on 2019’s national heat records, and additional perspective on the November global summary, see Dr. Jeff Masters’ new post at Eye of the Storm (ScientificAmerican.com).


