
| Above: Perhaps the most unusual image from the 2018 typhoon season, this Himawari-8 visible shot shows Typhoon Trami at 2330 UTC September 26, 2018. At the time, Trami was a Category 2 storm with 105-mph winds, and had an unusual “hub cloud” resembling a miniature typhoon in the eye (see animation here). Earlier, Trami had peaked as a Category 5 storm with 160-mph winds. Trami went on to become a billion-dollar disaster for Japan. Image credit: CIRA/RAMMB. |
Update: Hurricane Michael was upgraded to a Category 5 storm in post-analysis on April 19, 2019, putting the 2018 tally of Cat 5s at eleven.
Eleven Category 5 tropical cyclones troubled Earth’s tropical waters in 2018—the second highest total of these ferocious storms on record, going back to 1990. Only the super-El Niño-fueled year of 1997, with twelve Category 5 storms, had more. The year 2018 was the first year Category 5 storms were observed in all four tropical cyclone-prone ocean basins in the Northern Hemisphere: the Atlantic (Michael), Eastern Pacific (Willa), Central Pacific (Lane), and Western Pacific (multiple typhoons). Thanks go to Jasper Deng for this stat.
Earth averaged 5.1 Category 5 storms per year between 1990 - 2017, according to ratings made by NOAA's National Hurricane Center and the U.S. Navy's Joint Typhoon Warning Center, so 2018’s activity was extraordinarily high. Three of 2018’s Cat 5s made landfall at Category 5 strength—Hurricane Michael in the Florida Panhandle (160 mph winds), Super Typhoon Yutu in the U.S. Northern Mariana Islands (180 mph winds), and Super Typhoon Mangkhut in the Philippines (165 mph winds). Four of the Cat 5s of 2018 ended up being billion-dollar disasters: Hurricane Michael in the U.S., Super Typhoon Mangkhut in the Philippines/Hong Kong/China, Super Typhoon Trami in Japan, and Super Typhoon Jebi in Japan. Below is a rogue's gallery of all eleven Category 5 storms of 2018: Yutu, Willa, Kong-rey, Walaka, Trami, Marcus, Maria, Lane, Jebi, Michael, and Mangkhut.
 |
| Figure 1. Global Category 5 tropical cyclones from 1990 - 2018, as rated by NOAA's National Hurricane Center and the U.S. Navy's Joint Typhoon Warning Center. The quality of the database that rates Cat 5s is too poor and the time series of decent data on these storms is too short to make definitive conclusions about how climate change may be affecting these most fearsome of storms. However, climate change is expected to make Category 5 storms stronger and more numerous in the coming decades. |
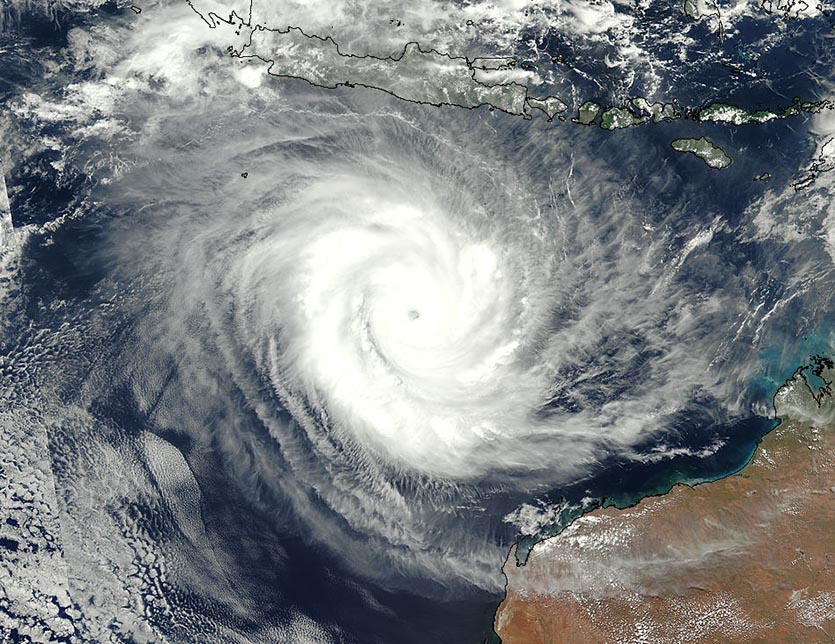 |
| Figure 2. Tropical Cyclone Marcus as seen at 6Z March 21, 2018, off the northwest coast of Australia. At the time, Marcus was a Category 4 storm with 145 mph winds. Image credit: NASA. |
The first Category 5 storm of 2018 was Tropical Cyclone Marcus, which intensified on March 21 to a low-end Cat 5 with 160-mph winds and a central pressure of 912 mb. This pressure ranked as the tenth lowest on record for an Australian tropical cyclone. Before becoming a Cat 5, Marcus hit the northern Australia city of Darwin as a tropical storm (see radar loop here), knocking out power to over 26,000 customers and causing $75 million in damage. Marcus brought a wind gust of 81 mph (130 kph) to Darwin, which was the highest gust from a tropical cyclone measured there since Tropical Cyclone Tracy devastated the city on Christmas Day in 1974. Marcus stayed well offshore of the northwest coast of Australia after hitting Darwin, and had no other direct impacts on populated areas.
Since accurate satellite records began in 1990, the Joint Typhoon Warning Center has catalogued eighteen Category 5 storms in the South Indian Ocean—an average of approximately one Cat 5 every two years. Marcus was the first Category 5 tropical cyclone in the South Indian Ocean since Tropical Cyclone Ernie, which intensified to a Category 5 storm with 160 mph winds northwest of Australia in April 2017. Tropical Cyclone Fantala of 2016 (180 mph winds) is the strongest cyclone ever observed in the South Indian Ocean.
 |
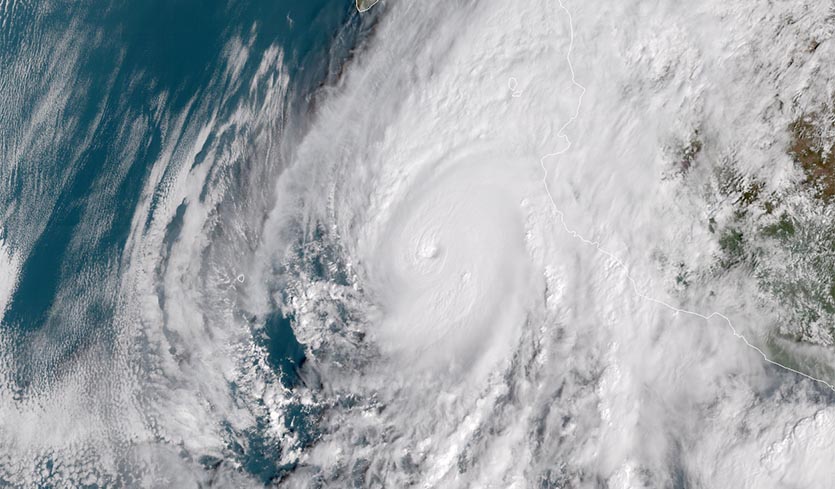
| Figure 3. Super Typhoon Maria as seen at 6Z July 6, 2018, a few hundred miles west-northwest of Guam in the Northern Mariana Islands. At the time, Maria was a Category 4 super typhoon with sustained winds of 155 mph, just below Category 5 strength. Image credit: NASA. |
After hitting Guam as a tropical storm on July 4, Super Typhoon Maria exploded into the Northwest Pacific’s first Category 5 storm of 2018, intensifying from a tropical storm with 70 mph winds to a Category 5 super typhoon with 160 mph winds and a pressure of 915 mb in just 24 hours. This is one of the fastest intensification rates ever observed for a tropical cyclone. The only comparable intensification rates I am familiar with:
- Super Typhoon Forrest strengthened by 100 mph in 24 hours in September 1983, according to NOAA's Hurricane Research Division.
- Hurricane Wilma deepened by 105 mph in 24 hours over the Caribbean Sea in 2005.
- Cyclone Ernie off the coast of northwest Australia (April 7, 2017) has been re-analyzed as having a 110 mph increase in 24 hours (thanks go to Jasper Deng for this).
- Hurricane Patricia in the eastern Pacific intensified by 120 mph in 24 hours in late October 2015 off Mexico's Pacific coast.
After hitting the Yaeyama Islands and brushing Taiwan on July 10, Maria made landfall over Fujian, China, early on July 11, killing two people and causing over $600 million in damage.
 |
| Figure 4. Hurricane Lane passing south of Hawaii’s Big Island (top left) at 2350Z August 21, 2018. At the time, Lane was a Category 5 storm with 160-mph winds. Image credit: NASA. |
Hurricane Lane was the most damaging Eastern Pacific storm of 2018, even though it never made landfall. Insurance broker Aon is estimating damage of over $200 million in Hawaii, with one person killed. Lane peaked as a Category 5 storm with 160-mph winds and a pressure of 922 mb on August 22, while located about 350 miles south of the Big Island. Lane was just the second Category 5 storm on record (along with John of 1994) to pass that close to Hawaii. As Lane trekked to the west of Hawaii and weakened, it slowed down, dumping prodigious rains on the islands. The 52.02 inches (1321 mm) recorded at Mountain View on the Big Island made Lane the wettest tropical cyclone on record for Hawaii—and the second-wettest tropical cyclone in U.S. history, behind Hurricane Harvey of 2017 (Texas).
 |
| Figure 5. VIIRS image of Hurricane Walaka on Tuesday morning, October 2, 2018. At the time, Walaka was at Category 5 strength with 160 mph winds. Image credit: NASA Worldview. |
Hurricane Walaka (the Hawaiian word meaning "ruler of the army") was one of the most intense Pacific hurricanes on record. After passing well south of the Hawaiian Islands as a tropical storm the last few days of September, Walaka rapidly intensified into a Category 5 storm with 160 mph winds and a central pressure of 920 mb on October 2. By minimum pressure, Walaka ranks as the second-strongest hurricane on record in the central Pacific, tied with Hurricane Gilma of 1994. Only Hurricane Ioke of 2006 (915 mb pressure) was stronger. By wind speed, Walaka ranks as the third strongest hurricane on record in the central Pacific (between 140°W and 180°W), behind John of 1994 and Patsy of 1959, which had 175 mph winds.
Walaka did not impact any populated islands, but passed very close to the uninhabited Johnston Atoll as a strong Category 4 hurricane, forcing the evacuation of four scientists. Moving northwards, Walaka’s storm surge inundated and washed away East Island in the French Frigate Shoals.
 |
| Figure 6. MODIS image of Super Typhoon Kong-rey on Tuesday morning, October 2, 2018. At the time, Kong-rey was at Category 5 strength with 160-mph winds. Image credit: NASA Worldview. |
Super Typhoon Kong-rey formed in late September in the waters west of the Federated States of Micronesia, intensifying into a Category 5 storm with 160-mph winds and a central pressure of 900 mb on October 2. After weakening to a tropical storm, Kong-rey moved across the southern end of the Korea peninsula, then raced across Japan’s northernmost large island, Hokkaido. Kong-rey killed three and did over $100 million in damage to South Korea and Japan. Kong-rey was a Cat 5 at the same time as Hurricane Walaka in the Central Pacific, marking just the seventh time in recorded history that Earth had experienced simultaneous Cat 5s.
 |
| Figure 7: In a stunning demonstration of the destructive potential of typhoon storm surge—and the human propensity to under-engineer infrastructure designed to withstand the worst nature has to offer—Japan’s third busiest airport, Kansai International Airport in Osaka Bay, lies inundated by Typhoon Jebi’s storm surge on September 4, 2018. The surge flooded one runway, closing it for ten days, and damaged electrical facilities in one of the airport’s two terminals, forcing its closure for seventeen days. Image credit: Kentaro Ikushima/Mainichi Newspaper via AP. |
Super Typhoon Jebi peaked as a Category 5 storm with 175 mph winds and a central pressure of 915 mb on August 31, and gradually weakened before making landfall in Western Japan near Osaka on September 4 as a Category 2 storm. Jebi caused widespread wind, storm surge, and flood damage of $3 – 5.5 billion. At least 17 people were killed and 600 injured. According to the Japan Meteorological Agency, Jebi was the strongest typhoon to strike Japan’s main island of Honshu since Typhoon Yancy of 1993.
 |
| Figure 8. Windows of a commercial building damaged by Typhoon Mangkhut on Sept. 16, 2018, in Hong Kong. City officials raised the storm alert to T10, its highest level, as Typhoon Mangkhut landed on Hong Kong. (Lam Yik Fei/Getty Images). |
After doing damage in the U.S. territory of the Northern Mariana Islands as a Category 2 storm, Super Typhoon Mangkhut peaked as a Category 5 storm with 180 mph winds and a central pressure of 905 mb. Mangkhut weakened slightly before hitting the far northern Philippines on September 15 as a Category 5 storm with 165-mph winds, killing at least 127 and causing over $600 million in damage. Mangkhut then made landfall in Hong Kong and China on September 16 as a borderline Category 2/Category 3 storm, according to the China Meteorological Agency. Mangkhut was regarded as the strongest typhoon to strike Hong Kong since Typhoon Ellen in 1983, and did close to $2 billion in damage in Hong Kong and China.
 |
| Figure 9. Super Typhoon Trami at 0050Z September 25, 2018. At the time, Trami lay south of Okinawa, Japan, and was a Category 5 storm with 160-mph winds. Image credit: CIRA/RAMMB. |
After peaking as a Category 5 super typhoon with 160-mph winds and a 915-mb pressure, Super Typhoon Trami brushed Okinawa, Japan as a Category 2 storm, then made landfall in Japan’s Wakayama prefecture on September 30 as a Category 1 storm with 85 mph winds. Trami caused widespread disruption and damage on the Japanese mainland, killing 4 and injuring more than 200. At least 6,000 homes and other structures suffered damage due to wind and flooding, with total damages of at least $1 billion.
 |
| Figure 10. GOES-16 visible image of Hurricane Willa at 11:15 am EDT October 22, 2018. At the time, Willa was a Category 5 storm with 160 mph winds. Image credit: NOAA/RAMMB. |
Hurricane Willa made landfall at Isla Del Bosque, Mexico on October 23 as a Category 3 storm with 120 mph winds. Willa was the only hurricane of the 2018 Eastern Pacific hurricane season to make landfall at hurricane strength, and just the 13th major hurricane on record to hit Mexico's Pacific coast. Widespread damage in excess of $50 million occurred in the hardest-hit Mexican states of Sinaloa, Nayarit, Jalisco, Durango, and Zacatecas, and six people were killed. Agricultural damage in the Las Cañas River basin alone was $10 million. At its peak, Willa was a Category 5 storm with 160-mph winds. Willa intensified in stunningly quick fashion: from a 35-mph tropical depression to a 160-mph Cat 5 storm in just 54 hours. This matches the record rate of intensification from tropical depression to Category 5 strength for the Atlantic, held by both Wilma (2005) and Maria (2017).
 |
| Figure 11. The NOAA 20 satellite captured the moment the eye of Super Typhoon Yutu passed directly over Tinian Island, one of three main islands of the U.S. commonwealth of the Northern Mariana Islands. Image credit: NOAA. |
Earth's strongest storm of 2018, Super Typhoon Yutu, hit Tinian Island in the U.S. Northern Mariana Islands on October 25 with sustained winds of 180 mph. Winds this strong at landfall are rarely observed, and Yutu is tied for fifth place for strongest tropical cyclone at landfall in world history, according to data from the National Hurricane Center (NHC) and Joint Typhoon Warning Center (JTWC). The only stronger landfall in the U.S. or its territories was the 1935 Labor Day hurricane in the Florida Keys, with 185-mph winds. According to the Japan Meteorological Agency, Yutu’s central pressure at landfall was 900 mb, which ties it with Hurricane Camille of 1969 as the second-lowest landfalling pressure for a tropical cyclone hitting the U.S. Only the 1935 Labor Day hurricane in the Florida Keys had a lower pressure at landfall—892 mb. Yutu killed 2 in the Northern Marianas, and destroyed or damaged most of the structures on Tinian. Yutu went on to hit the Philippines as a Category 2 storm on October 30, killing 27 and causing $75 million in damage.
 |
| Figure 12. Bela (left) and Jaques Sebastiao begin the process of cleaning up their home after it was heavily damaged by Hurricane Michael, on October 17, 2018, in Mexico Beach, Florida. Image credit: Joe Raedle/Getty Images. |
Hurricane Michael roared ashore in Florida’s Panhandle as a low-end Category 5 storm with 160-mph winds on October 10, 2018, pushing a storm surge of 15+ feet to the coast. Michael killed 16 people and did damage of $25 billion, including $2.3 billion in damage to the Florida and Georgia timber industries and $2 billion in agricultural damage to Georgia.
The almost-Cat 5 of 2018: One other tropical cyclone just missed achieving Category 5 status in 2018, topping out with 155 mph winds (157 mph winds are the threshold for a Cat 5): Hurricane Hector in the Central Pacific. It is possible that post-season analysis will end up upgrading Hector to Category 5 status.
 |
| Figure 13. The strongest tropical cyclones at landfall in world history, according to data from the National Hurricane Center (NHC) and Joint Typhoon Warning Center (JTWC). Ominously, 7 of the 10 strongest landfalls in recorded history have occurred since 2006. Yutu’s landfall with 180 mph sustained winds on Tinian in the U.S. Northern Mariana Islands is tied as the fifth strongest landfall ever recorded globally. The only stronger landfall in the U.S. or its territories was the 1935 Labor Day hurricane in the Florida Keys, with 185 mph winds. Note that NHC supplies specific landfall intensity data, while the JTWC does not. Thus, the JTWC landfall intensities above are from the last 6-hourly position point of the tropical cyclone before landfall. |


#/media/File:Lane_2018-08-21_2350Z.jpg)