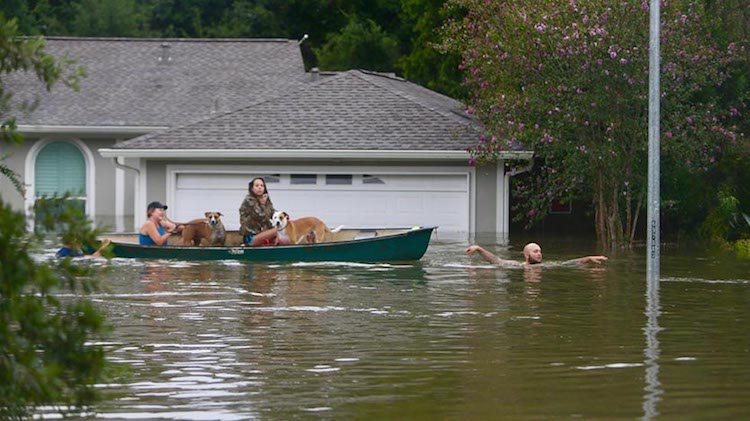
| Above: Two kayakers try to beat the current pushing them down an overflowing Brays Bayou from Tropical Storm Harvey in Houston, Texas, Sunday, Aug. 27, 2017. (Mark Mulligan/Houston Chronicle via AP) |
One of the worst flood disasters in modern U.S. history unfolded on Sunday in the Houston area, driven by relentless rains from Tropical Storm Harvey. Rainband after rainband swept north and translated slowly east through the metro area from Saturday into Sunday morning, dropping totals on the order of 20”-25”. Freeways and streets throughout the Houston area were impassable on Sunday morning, and many hundreds of homes were flooded, with numerous reports of trapped residents. At least 6 deaths had been reported in the Houston area by midday Sunday. Even more concerning is the prospect of additional extreme rains—one to two feet or more—before Harvey moves out of southeast Texas later this week. Points east from Houston into southern Louisiana will also be at an increasing risk of torrential rain and major flooding over the next several days.
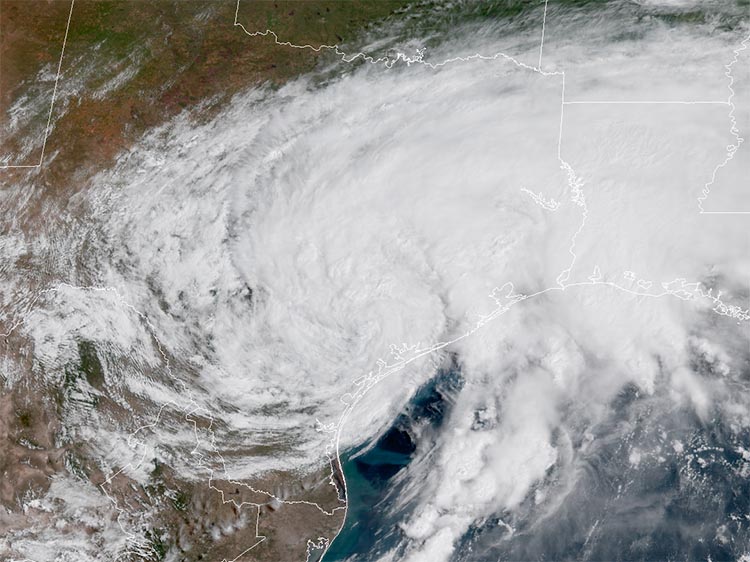
The colossal rains across Houston are spinning around Tropical Storm Harvey, which is crawling its way just inland from the central Texas coast. At 10 am CDT Sunday, Harvey was located about 35 miles west-northwest of Victoria, or less than 100 miles north of its San Jose Island landfall location from Friday night. Large-scale steering currents have collapsed around Harvey, with no signs of anything that will sweep the storm away from the area for the next several days. Harvey was drifting southeast at just 2 mph on Sunday morning, with minimal tropical-storm-strength sustained winds of 40 mph.
 |
| Figure 1. A family evacuates their Meyerland home in Houston on Sunday, August 27, 2017. Image credit: Mark Mulligan/Houston Chronicle via AP. |
 |
| Figure 2. Tropical Storm Harvey over Texas, as seen by the GOES-16 satellite at 11 am CDT Sunday, August 27, 2017. Image credit: NOAA/RAMMB. GOES-16 data are considered preliminary and non-operational. |
Harvey’s winds are expected to remain modest, and it could become a tropical depression at any point, but winds are not the problem here. The NOAA/NWS National Hurricane Center now predicts that Harvey will inch its way into the Gulf of Mexico—though just barely—by Monday night, then arc northeast and make a second landfall just west of Houston on Wednesday. The 12Z GFS and 00Z European model runs agree on a general northward motion for Harvey across eastern Texas, beginning around midweek.
At this point it may make little difference whether Harvey stays just inland or moves just offshore, since rainbands would continue to be funneled toward Houston either way. The fine-scale particulars of this outlook may shift over time, but the overall message is consistent: Harvey will be a devastating rainmaking presence in southeast Texas for days to come.
| Figure 3. WU depiction of NHC 5-day outlook for Hurricane Harvey as of 10:00 am CDT Sunday, August 27. The concentric circles indicate how slowly Harvey is expected to move until at least Wednesday. |
Much more rain still to come
Harvey’s circulation is located in a near-ideal spot for funneling vast amounts of moisture from the Gulf of Mexico toward the upper Texas coast. Here, converging winds at low levels have been concentrating the moisture into north-south-oriented bands of intense thunderstorms with torrential rain. Since Harvey is barely moving, these bands are creeping only slowly eastward as individual cells race north along them—a “training” set-up that is common in major flood events.
Mesoscale models, our best guidance for short-term, small-scale behavior of thunderstorms, show little sign of relief for southeast Texas anytime soon. Convection-resolving mesoscale models, which have a tight enough resolution to depict individual thunderstorms, are an invaluable tool in situations like this. The mesoscale nested NAM model predicts that 20” – 30” of additional rainfall is likely through Tuesday across the Houston metro area, with even larger totals at some points (see embedded tweet below).
From one of our best mesoscale models...an additional 1-3 feet of rain forecast to fall by Tuesday evening. #Harvey pic.twitter.com/x5FYqpFlRh
— Victor Gensini (@gensiniwx) August 27, 2017
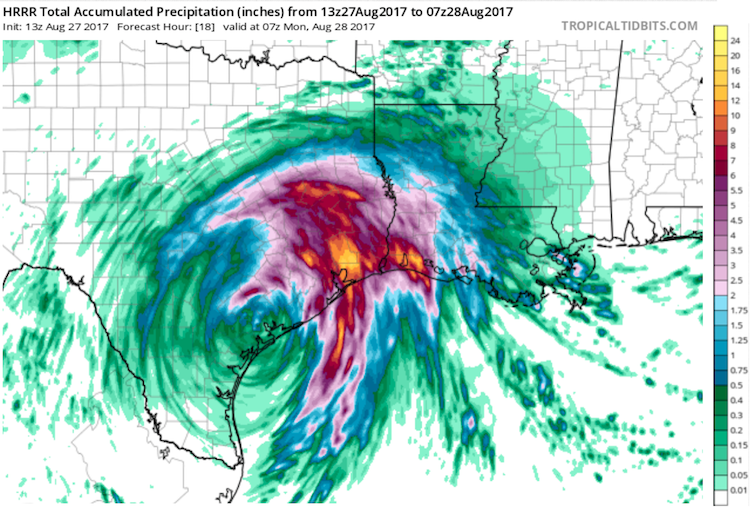
The HRRR mesoscale forecast model deserves major kudos for capturing the incredible extent of rainfall in its 18-hour forecasts issued hourly on Saturday (see one such outlook spotlighted in our Saturday post). HRRR made it clear that the Houston area could receive 10” – 20” of rain on Saturday night, which indeed it did. The latest runs of the HRRR model suggest that rainbands may become more sporadic across the Houston area on Sunday afternoon before again intensifying on Sunday night, as nighttime atmospheric processes across the Gulf of Mexico help strengthen the rainbands pushing onshore. The extreme rainfall is predicted to extend into the Beaumont-Port Arthur and Lake Charles areas. If a gradual eastward shift occurs in the favored rainband location, as suggested by the HRRR, it is possible that the very heaviest rains tonight and early Monday will be focused toward the northeastern half of the Houston region.
 |
| Figure 4. Rainfall projected by the High-Resolution Rapid Refresh model (HRRR) for the entire 18-hour model run from 8:00 am CDT Sunday, August 2017, through 2:00 am CDT Monday. The heaviest rain is projected by HRRR to occur across eastern parts of the Houston area, but 5” – 10” amounts are predicted throughout the area into early Monday morning, with additional rain still to come. Image credit: tropicaltidbits.com. |
With luck, Houston will get breaks of a few hours in between assaults from rainbands, but the overall pattern is unlikely to change until the focused area of convergence associated with Harvey pushes east of the metro area. This should eventually happen, although it may take a day or more, and the process will depend in part on exactly where Harvey tracks. Apart from the rainbands, there may be a concentrated zone of torrential rain near and just northeast of Harvey’s center. This could pose additional problems by Tuesday or Wednesday, especially if Harvey drifts toward Houston. In short, the highest levels of vigilance remain in order.
Tornadoes will continue to be a threat in the rainbands east of Harvey’s center. The NWS Houston office has issued more than 100 tornado warnings since Friday, a record-smashing total, and 20 tornado reports have been compiled by the NOAA/NWS Storm Prediction Center for Friday and Saturday.
A record-high water level of 8.66’ above ground on the east side of Houston
At 1:24 pm CDT Sunday, the Manchester tide gauge, located on an estuary on the east side of Houston, recorded a remarkable storm surge that was nine feet and rising. According to storm surge expert Dr. Hal Needham, this surge was likely 95% due to the huge amounts of freshwater river runoff trying to drain into Galveston Bay from this morning’s torrential rains. This runoff was unable to drain because of strong onshore winds that were pushing a salt-water storm surge inland, opposing the freshwater runoff. The storm tide (combination of the surge plus the tide) was 8.66’ above the high tide mark (Mean Higher High Water, or MHHW) at Manchester at 1:24 pm CDT. This is a new record-high water level for the gauge, going back to when records began in 1998. The previous record at Manchester was 6.16' above MHHW, set on 9/11/1998, during Tropical Storm Frances, which made landfall north of Corpus Christi on September 11 as a moderately strong tropical storm. Rainfall from Frances peaked at 21.76 in (553 mm) in Goose Creek, on the east side of Houston, and caused large amounts of flooding in southeast Texas and southwest Louisiana. Frances caused $500 million in property damage.
Rainfall reports to date
As of 10 am CDT Sunday, the National Weather Service Storm Summary (updated every 6 hours) listed four locations near Houston that had received over 24” of rain since the storm began on Thursday:
DAYTON 0.2 E 27.45
SANTA FE 0.7 S 27.42
SOUTH HOUSTON 4.0 SSW 24.54
LA MARQUE 1.8 E 24.53
LEAGUE CITY 2 W 22.08
BACLIFF
PEARLAND 3 NNE 20.84
BERRY BAYOU AT NEVADA AVENUE 19.52
BEAMER DITCH AT HUGHES ROAD 19.28
LA GRANGE 10.2 NW 18.89
HORSEPEN CREEK AT BAY AREA BOULEVAR 18.56
CIRCLE D-KC ESTATES 3.6 ESE 18.02
SUGAR LAND 1.0 W 17.97
CLEAR CREEK AT BAY AREA BLVD 17.84
MAGNOLIA 2.8 S 17.80
PASADENA 2 NW 17.72
WALLER 3.0 WSW 17.57
HOUSTON 1.4 NE 17.22
GOOSE CREEK AT BAKER ROAD 16.56
CLEVELAND 3.6 S 16.43
NEW ULM 5.1 S 16.14
PECAN GROVE 1 NNW 15.80
SMITHVILLE
ALVIN 3 SW 15.16
AUSTWELL 6 SSE 15.10
VICTORIA 2 SW 9.37
HOUSTON/HULL FIELD 7.33
CORPUS CHRISTI INTL ARPT 2.70
The vast majority of this rain fell in the 33-hour period beginning at 2 am CDT Saturday.
Below are some of the personal weather stations that received over 16” of rain on Sunday as of noon CDT. The numbers given are Sunday’s rain, Saturday’s rain, and the 2-day storm total. Given that this event still has 2 to 4 more days to go, it appears likely that some location in Texas will break the all-time record for U.S. rainfall from a tropical cyclone or its remnants: 48.00” in 1979 from Amelia. Another record to watch: the all-time 24-hour U.S. record rainfall of 42", set in Alvin, TX (just south of Houston) on July 25-26, 1979, in association with Tropical Depression Claudette.
22.03”, 8.04”, 30.07”: Baytown, TX (Country Club Oaks)
21.47”, 6.12”, 27.59”: Dayton, TX (Winter Valley)
20.19”, 5.90”, 26.09”: Dayton, TX (Brookstone)
19.94”, 8.27”, 28.21”: Seabrook, TX (Baybrook)
19.83”, 5.17”, 25.00”: Baytown, TX (Eastpoint)
19.14”, 6.94”, 26.08”: League City, TX (MarBella – Lorca Ln.)
18.00”, 5.23”, 23.23”: League City, TX (Whispering Lakes Ranch)
17.68”, 10.46”, 28.14”: League City, TX (South League City)
16.81”, 4.73”, 21.54”: Baytown, TX (Chaparral Village)
16.72”, 2.47”, 19.19”: Baytown, TX (Evergreen Fairway)
 |
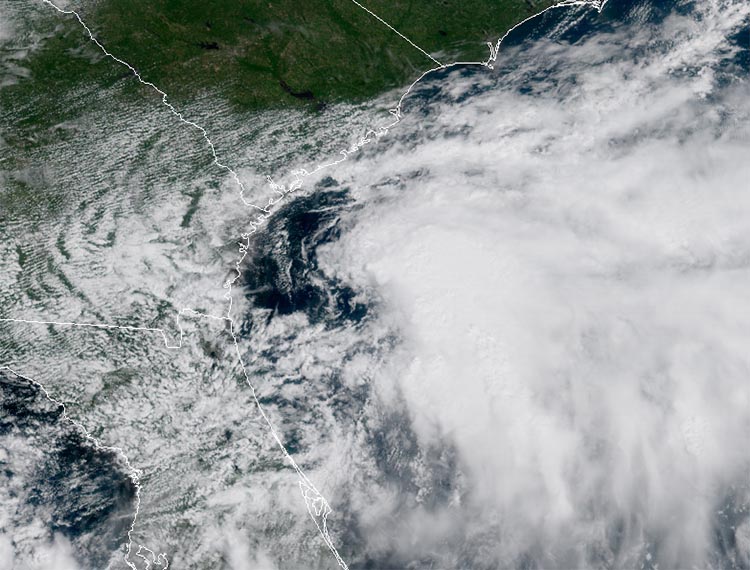
| Figure 4. Invest 92L near the coast of Georgia, as seen by the GOES-16 satellite at 11 am CDT Sunday, August 27, 2017. Image credit: NOAA/RAMMB. GOES-16 data are considered preliminary and non-operational. |
92L slowly organizing off the coast of Georgia
An area of low pressure (92L) was located over the waters off the coast of Georgia on Sunday. Satellite images showed that 92L had a modest amount of heavy thunderstorm activity and was gradually becoming more organized, but high wind shear of 25 - 35 knots was hindering development. The system is moving to the northeast, and will bring heavy rains and rough surf to Georgia and South Carolina on Monday, and to North Carolina and Virginia on Tuesday. The best chances for development may come on Monday, when wind shear is expected to drop to 25 - 30 knots, according to the 12Z Sunday run of the SHIPS model. In its tropical weather outlook issued at 2 pm EDT Sunday, the National Hurricane Center gave 92L 2-day and 5-day odds of development of 70%. The storm is unlikely to gain sustained winds any higher than 45 mph as a tropical or subtropical cyclone, and will merge with a cold front and move to the northeast, out to sea, on Wednesday.
The next African tropical wave may develop
A tropical wave predicted to emerge from the coast of Africa on Sunday night has the potential to develop into a tropical depression by Thursday over the central tropical Atlantic, according to the 0Z and 12Z Sunday runs of our top three models for predicting tropical cyclone genesis, the European, GFS, and UKMET models. The wave is predicted to head west to west-northwest at about 15 mph. The earliest the wave would reach the northern Lesser Antilles Islands would likely be Tuesday, September 5, but the storm may turn northwest and miss the islands entirely. In its tropical weather outlook issued at 2 pm EDT Sunday, the National Hurricane Center gave this new wave 2-day and 5-day odds of development of 0% and 20%, respectively.
UPDATE: Water has risen a foot in 15 min. I'm one of the last in the building. God help us. @FoxNews @CNN @weatherchannel @GaughanSurfing pic.twitter.com/ZyGQlrprDh
— Blake Mathews (@KHOUBlake11) August 27, 2017
Keeping tabs on the Houston flood disaster
The best source of official flood statements and warnings is the NWS/Houston office, including its website and its Twitter and Facebook feeds. Houston TV station KHOU, whose studios were inundated on Sunday morning (see embedded tweet below), has been livestreaming the flood. Space City Weather and the Houston Chronicle are providing excellent local coverage.
Whatever you do, if you’re anywhere in the flooded areas of Texas and Louisiana, avoid driving as much as possible—and do not assume the roadway is where you expect it to be (see embedded tweet below).
We’ll be back with an update on Sunday night.
Jeff Masters co-wrote this post.
shared with me by a friend in SW Houston... pic.twitter.com/LEacsG2o88
— Marshall Shepherd (@DrShepherd2013) August 27, 2017


