| Above: VIIRS image of three hurricanes in the Atlantic on Thursday, September 7, 2017: Cat 1 Katia (left), Cat 5 Irma (center), and Cat 3 Jose (right.) Image credit: NASA. |
Hurricane Irma plowed through the Turks and Caicos Islands (population 31,000) on Thursday evening, as it headed west-northwest at 16 mph towards The Bahamas and Florida. Irma maintained Category 5 intensity with 175 mph winds as its eye crossed the small privately-owned Big Ambergris Cay, but the core of the hurricane missed the capital of Cockburn Town, and may pass just south of Providenciales, the most heavily populated island in the country.
Hurricane hunter observations on Thursday evening showed lower winds in Irma than earlier in the day, and found a distinct double wind maximum, caused by concentric eyewalls. By my count, this may be Irma’s 7th eyewall replacement cycle, and appears to be the first one that has notably degraded the hurricane’s maximum winds. The Air Force hurricane hunter plane in the storm Thursday night found top surface winds near 165 mph on their first pass through the eye near 7:35 pm EDT, but only 140 mph on their second pass through near 9 pm EDT. The pressure stayed nearly constant in the two passes, at 920 and 921 mb, respectively. The reduction in the peak winds is not necessarily a good thing, since the hurricane hunter data showed that the hurricane-force winds of the storm had spread out over a larger area, which will increase the storm surge. In addtion, the fact that Irma maintained its very low pressure may mean the aircraft may have missed sampling the strongest winds of the hurricane. Total precipitable water loops showed that part of Irma’s apparent weakening may be due to the island of Hispaniola blocking the inflow of moisture from the south, which was reducing the amount of moisture to the storm. This effect will diminish on Friday morning, when Irma moves to the west of Hispaniola. The hurricane will then be drawing air from the south over high terrain in Cuba, but the blocking effect of Cuba is much less than that of Hispaniola. I don't see any reason for Irma to weaken further through Saturday, and it may intensify again to 185 mph winds.
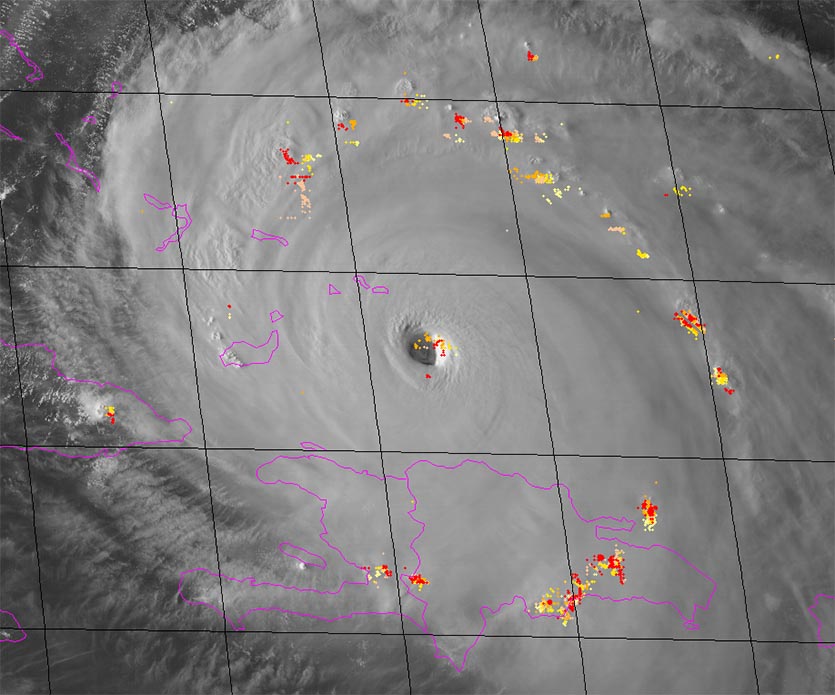 |
| Figure 1. GOES-16 visible image of Hurricane Irma taken at 5:27 pm EDT September 7, 2017, with lightning strikes from the Global Lightning Mapper (GLM) instrument on GOES-16 overlaid. Image credit: U-Madison/CIMSS. |
Forecast for Irma
Update: At 11 pm EDT Thursday, NHC issued Hurricane and Storm Surge Warnings for the south coast of the Florida peninsula from Bonita Beach around to Jupiter Inlet, including the Florida Keys. The Storm Surge Warning includes Lake Okeechobee.
The ridge of high pressure steering Irma turned out to be stronger than expected on Thursday, and forced the hurricane to move farther south than the models had been predicting. This resulted in a westward shift in the predictions for Irma’s turn to the north by Florida this weekend. As of 10 pm EDT Thursday, the latest available runs (12Z or 18Z) of all of our top models for tracking hurricanes—the European, GFS, HWRF, HMON, and UKMET—had Irma making landfall in South Florida Sunday morning, then turning north. All of the members of the high-probability cluster of the European model ensemble (Figure 2) also showed this track. The only ray of hope for South Florida could be found in the ensemble members of the 12Z GFS ensemble (Figure 3), which had a few members missing the peninsula. Since the average error in a 3-day forecast is 120 miles, it is important to remember that the models may still have additional shifts, and one must pay attention to the NHC cone of uncertainty! If you are in the cone of uncertainty, you are in danger of a direct hit.
 |
| Figure 2. The 20 track forecasts for Irma from the 12Z Thursday, September 7, 2017 GFS model ensemble forecast. Image credit: CFAN. |
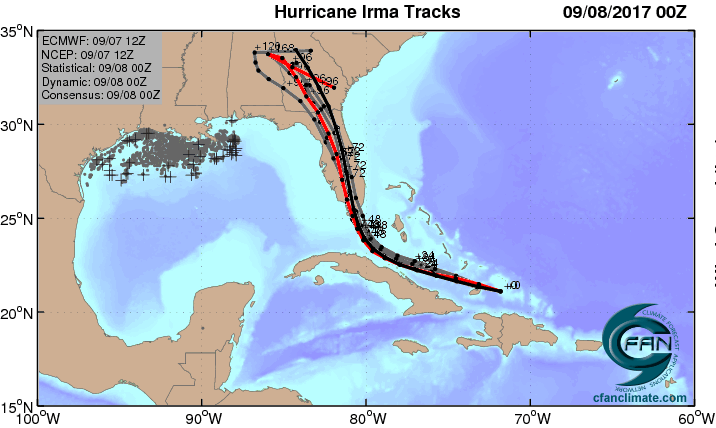 |
| Figure 3. The 12Z September 7, 2017, track forecast by the operational European model for Irma (red line, adjusted by CFAN using a proprietary technique that accounts for storm movement since 12Z Thursday), along with the track of the average of the 50 members of the European model ensemble (heavy black line), and the track forecasts from the “high probability cluster” (grey lines)—the five European model ensemble members that have performed best with Irma thus far. The seven forecasts are in remarkable agreement. Image credit: CFAN. |
Lake Okeechobee dike probably not at risk
The shores of Lake Okeechobee are the site of the second deadliest natural disaster in U.S. history--the 1928 Okeechobee Hurricane. This mighty hurricane caused catastrophic damage where it struck the Florida coast as a Category 4 storm near Palm Beach, and weakened only slightly to Category 3 strength with 130 mph winds when it passed over Lake Okeechobee. The powerful winds of the hurricane brought a 12' storm surge to the south end of the lake, which overwhelmed the 6' high levees protecting the farm lands to the south. The resulting flood covered an area of hundreds of square miles with water up to 20' deep, and killed at least 2,500 people--mostly black migrant farm workers.
To prevent a recurrence of this disaster, the 25 - 30'-tall, 143-mile long Herbert Hoover Dike surrounding the lake was built in the 1930s out of gravel, rock, limestone, sand, and shell using old engineering methods. The dike is tall enough that it cannot be overtopped by a storm surge from anything but an extreme hurricane, but the dike is vulnerable to leaking and failure when heavy rains bring high water levels to the lake. The Army Corps of Engineers has spent $870 million since the early 2000s to shore up the aging structure, but needs to spend another $800 million and work into the mid-2020s to complete the dike’s rehab. A 2011 risk assessment estimated the dike's probable failure rate at every fourteen years.
The 18Z Thursday run of the HWRF model, our top intensity model, predicts that Irma’s western eyewall will bring northerly Category 3-strength winds of 115 mph to Lake Okeechobee on Sunday night. From what I understand, the storm surge that these winds would drive is not a concern for causing failure of the dike; it’s the storm’s rains that are a bigger concern. The 10 – 15” of rain could easily cause the lake to rise 3 – 4 feet over the next month, putting stress on the dike. Fortunately, the lake is at a lower-than-average level for this time of year (about 13.5 feet), thanks to drought conditions that gripped Florida earlier this year. A rise of 3 – 4 feet would keep the lake under the danger level of 18 feet. However, we are only halfway through hurricane season, and the rains from another very wet hurricane or tropical storm hitting the state would be a significant danger to the dike. The Army Corps began dumping water out of the lake on September 5 in preparation for the hurricane, and these efforts will have to continue for the rest of September to keep the dike safe. Unfortunately, this will cause severe pollution problems along both coasts of Florida where the fertilizer-laden water drains.
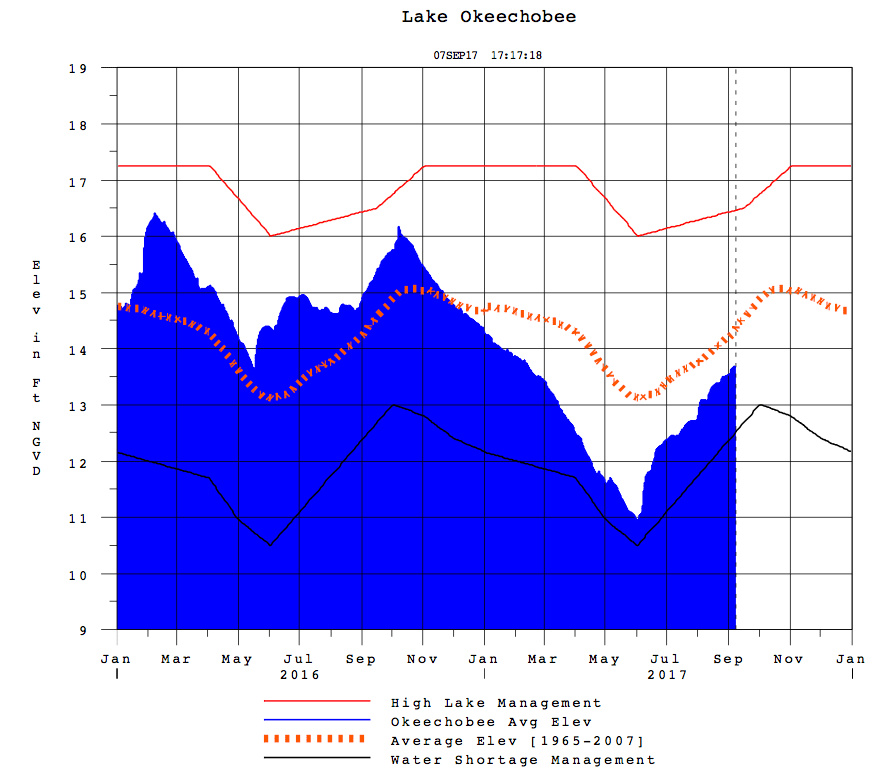 |
| Figure 4. Lake Okeechobee water level. A 2008 Army Corp of Engineers study said this about the vulnerable dike surrounding the lake: "There is limited potential for a dike failure with lake levels as low as 18.5 feet. The likelihood of a failure increases at higher lake levels. At a lake level of 21 feet--a 1-in-100-year flood event--a dike failure would be likely at one or more locations. In the event of a dike failure, waters from Lake Okeechobee would pass through the breach--uncontrollably--and flood adjacent land. Flooding would be severe and warning time would be limited. And with 40,000 people living in the communities protected by the Herbert Hoover Dike, the potential for human suffering and loss of life is significant.” Image credit: USACE. |
No way, Jose: Atlantic gets its third major Atlantic hurricane of 2017
The Atlantic hurricane season has now produced more than a year’s worth of major hurricanes before the season is even half over. Hurricane Jose reached Category 3 strength at 5:00 pm EDT, the third storm in a row to do so, after Harvey and Irma. Jose’s winds were up to 120 mph in the 8:00 pm EDT advisory, which placed the center about 540 miles east of the Leeward Islands. Tracking west-northwest, Jose was located only about 80 miles south of where Irma prowled just three days ago. Typically, such a path would encounter cold water churned up by the preceding hurricane, but it appears that Jose’s small core is staying just south of the cold wake left by Irma. Jose has also shrugged off moderate wind shear of around 15 knots, with the help of warm SSTs of around 29°C (84°F) and a fairly moist atmosphere (mid-level relative humidity close to 60%).
Jose’s rapid deepening should come to an end shortly, as its west-northwest path will soon intersect Irma’s west-southwest path. By late Friday, Jose will be directly over the cold wake left by Irma, where SSTs over a small area have dropped below the 26°C threshold for sustaining tropical cyclones. This wake may not be reflected yet in all forecast models. Jose will also be ingesting some dry air by late Friday into Saturday, so it is likely to peak at its current Category 3 strength. Still, in a one-two punch horrifying to ponder, Jose may spend Saturday rolling across some of the northern Leeward Islands hardest hit by Irma earlier this week. Hurricane watches are in effect for Antigua, Barbuda, and St. Martin/Sint Maarten. We can hope that the 12Z Thursday European model ensemble runs are correct, as they generally keep Jose northeast of the islands, whereas a good fraction of GFS ensemble runs bring the hurricane over or very near the islands. The official NHC track, midway between the operational Euro and GFS models, brings Jose within about 50 miles of Barbuda, which would probably be far enough to avoid major impacts from this compact hurricane.
Models agree that Jose will arc northwestward from that point, slowing to a crawl well southwest of Bermuda by midweek. Long-range models remain in wild disagreement on Jose’s eventual fate: the 12Z Thursday European ensemble runs favor an eventual west or north motion, while most of the GFS ensemble runs take Jose northeastward.
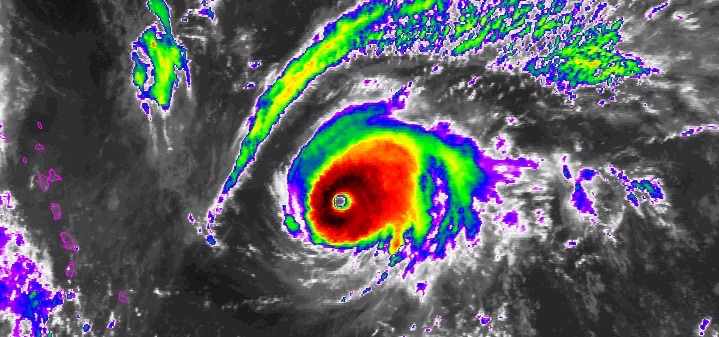 |
| Figure 5. Enhanced infrared image of Hurricane Jose as of 9:45 pm EDT Thursday, September 7, 2017. The northern Leeward Islands are outlined at far left. Image credit: NOAA/NESDIS. |
Katia intensifying in Bay of Campeche
Another small hurricane, Katia, was rapidly gaining strength Thursday night while holding stationary about 200 miles east of Veracruz, Mexico. As of 8:00 pm EDT Thursday, Katia was packing sustained winds of 80 mph. Based on Katia’s improving satellite appearance, with an eye beginning to appear, Hurricane Hunters en route to the storm are likely to find stronger winds. A hurricane warning is in effect from Cabo Rojo to Laguna Verde, Mexico.
Steering currents are expected to kick in and push Katia toward the coast of Mexico’s Veracruz state by Friday night. Katia is a small hurricane, which allows for more rapid strengthening and weakening based on the conditions in play. From Thursday up to landfall, Katia will be encountering very warm SSTs (30-31°C or 86-88°F) and light to moderate wind shear, with a dip in wind shear below 10 knots from Thursday night through Friday. Given the very moist atmosphere enveloping Katia (mid-level relative humidities of around 70%), it is quite possible Katia could become a major hurricane before landfall. The official NHC forecast as of 5 pm EDT Thursday tops out at 105 mph.
Should we end up with three simultaneous major hurricanes at some point on Friday or early Saturday (a real possibility), it will be a first in Atlantic records going back to 1851, and certainly for the satellite era, going back to the 1970s. Our last set of three simultaneous hurricanes—2010’s Igor, Karl, and Julia—were all majors, but there was no overlap between their periods of Category 3 or stronger intensity. According to Phil Klotzbach, the only time on record with three simultaneous Category 2 storms in the Atlantic was in 1893. He noted: “Of course, there may have been some underestimates in storm intensity during the Grover Cleveland administration!”
Bob Henson co-wrote this post.
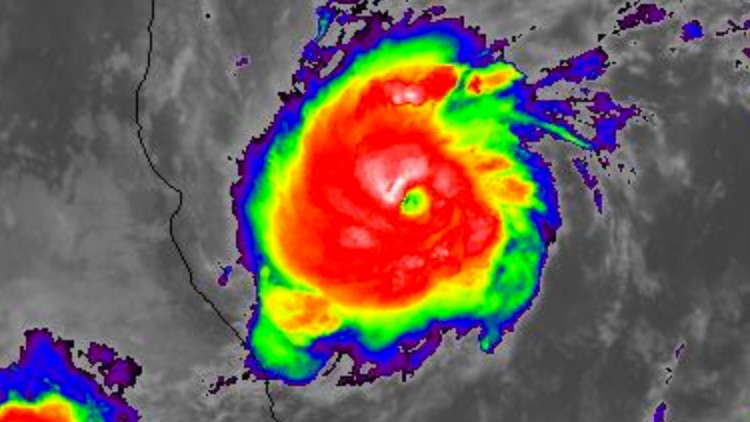 |
| Figure 6. Infrared image of Hurricane Katia as of 10:02 pm EDT Thursday, September 7, 2017. Image credit: NASA/MSFC Earth Science Branch. |


